by John | Dec 11, 2016 | Stocks I Like, Value Investing
Value Stock Picks – December 2016
I’m a value investor which means I buy stock in profitable companies trading at a discount.
I have hopes for a paid stock newsletter (Global Value Intelligence). But I’ve decided to put GVI on hold and share what I’ve written in past GVI issues, as well as provide new stock information. I intend for this information to remain free for some time.
I’ll be tracking the stocks I like over at my Value Stock Picks page.
The information presented here, like all the content on this website, is not investment advice. These are stocks I own (or intend to own) but they might not be suitable for you. The information presented is accurate to the best of my knowledge, but no guarantee of accuracy is made.
Prices are as of 9 December 2016 on market close, unless otherwise noted. Market data is from morningstar.com.
Below are some of the stocks I like:
Nissan (NSANY on NYSE)
| Price |
Market Cap |
Shareholder’s Equity |
Price to Book |
Earnings per Share |
Yield |
Return on Equity (TTM) |
Price to Earnings (TTM) |
| $19.58 |
$38.7 bil |
$40.9 bil (converted from JPY) |
1.0 |
$2.16 (converted from JPY) |
4.20% |
10.5% |
9.5 |
Nissan has a price to book of 1.0 and an attractive 4.20% yield. It is an ADR and has no options. I generally prefer to own a stock on it’s native exchange, with the ability to sell covered calls, but I still like this stock for it’s attractive metrics, brand and yield.
Transocean (RIG on NYSE)
| Price |
Market Cap |
Shareholder’s Equity |
Price to Book |
Earnings per Share |
Yield |
Return on Equity (TTM) |
Price to Earnings (TTM) |
| $15.42 |
$5.6 bil |
$14.5 bil |
0.4 |
$2.16 |
– |
8.1% |
4.7 |
The oil market in general has been pretty beaten down of late. The price to book is 0.4 which amounts to a 60% off sale. Despite the low price, Transocean is profitable, boasting $791 million in net income in 2015.
Mount Gibson Iron (MGX on ASX)
| Price |
Market Cap |
Shareholder’s Equity |
Price to Book |
Earnings per Share |
Yield |
Return on Equity (TTM) |
Price to Earnings (TTM) |
| A$0.34 |
A$372.8 mil |
A$392 mil |
0.9 |
A$0.08 |
– |
24.7% |
4.4 |
I first discussed MGX in the October 2016 Global Value Intelligence Dispatch (GVI has since been put on hold). At that time it was trading at A$0.29.
Writeup as of October 2016
MGX is an iron ore mining company in Western Australia. It can boast A$392 million in shareholder’s equity but is trading at a market capitalization of just A$318 million. This means the company’s stock could rise by over 23% before its market value would even be equal to its equity.
Mount Gibson Iron recently received a A$86 million insurance settlement and is set to receive an additional payout in the future. Not only is this company undervalued but it brought in A$6 million in the three month quarter ending in June.
PanTerra Gold (PGI on ASX)
| Price |
Market Cap |
Shareholder’s Equity |
Price to Book |
Earnings per Share |
Yield |
Return on Equity (TTM) |
Price to Earnings (TTM) |
| A$0.08 |
A$9.6 mil |
A$39 mil |
0.2 |
A$0.41 |
– |
138.9% |
0.4 |
I first discussed PGI in the October 2016 Global Value Intelligence Dispatch (GVI has since been put on hold). At that time it was trading at A$0.08.
Writeup as of October 2016
This stock is currently trading for 1/3 the book value and presents an exceptional value.
Despite the low Price to Book ratio PGI is still profitable. PGI brought in A$8 million in cash in 2015. In the most recent quarter PGI reported a 4% increase in gold production over the prior quarter and operating costs
3.7% lower.
Gold and gold miners have been beaten down over the past few years. By purchasing a stock in a depressed sector below book value there is a great deal of downside protection.
Triton International (TRTN on NYSE)
| Price |
Market Cap |
Shareholder’s Equity |
Price to Book |
Earnings per Share |
Yield |
Return on Equity (TTM) |
Price to Earnings (TTM) |
| $19.23 |
$674.3 mil |
$665 mil |
1.0 |
$2.67 |
9.16% |
10.7% |
9.4 |
I first discussed TRTN in the October 2016 Global Value Intelligence Dispatch (GVI has since been put on hold). At that time it was trading at $13.19.
Writeup as of October 2016
Triton International trades and leases intermodal containers and chassis. It features an attractive price to book ratio combined with a high dividend yield.
Triton recently merged with TAL and paid out a $.45 dividend on 22 September. This high dividend is most likely not sustainable. Shipping has been declining of late, but TRTN still managed to bring in $18.2 million in pre-tax income in Q2 2016.
Noble Energy (NE on NYSE)
| Price |
Market Cap |
Shareholder’s Equity |
Price to Book |
Earnings per Share |
Yield |
Return on Equity (TTM) |
Price to Earnings (TTM) |
| $7.64 |
$1.9 bil |
$6.69 bil |
0.2 |
$2.06 |
5.07% |
3% |
7.8 |
I first discussed NE in the October 2016 Global Value Intelligence Dispatch (GVI has since been put on hold). At that time it was trading at $6.34.
Writeup as of October 2016
Oil has been falling and with it the value of energy producers. Despite falling oil prices, NE is a fantastic value. The company has $6.7 billion in shareholder’s equity, but is trading with a Market Capitalization of $1.5 billion.
The 5.36% yield is attractive but not sustainable. Despite low oil prices Noble Corp is profitable. The most recent quarter that ended in June resulted in $687 million in cash from operations.
Anthem (ANTX on NYSE)
| Price |
Market Cap |
Shareholder’s Equity |
Price to Book |
Earnings per Share |
Yield |
Return on Equity (TTM) |
Price to Earnings (TTM) |
| $47.07 |
$12.4 bil |
$23 bil |
0.5 |
$9.38 |
2.77% |
9.5% |
5.5 |
I first discussed ANTX in the November 2016 Global Value Intelligence Dispatch (GVI has since been put on hold). At that time it was trading at $46.83.
Writeup as of November 2016
Anthem is a mid-sized health benefits company that works with employers and individuals to offer network based healthcare plans. While recent government incursions into the healthcare industry make me leery to invest in this sector I find the metrics to be quite favorable.
The Price to Book ratio is excellent, the yield is attractive and the company is profitable. I also think Anthem is well positioned to benefit from the “baby-boomer” generation (those age 50-85) as more of them retire each year.
Disclaimer:
As of 11 December 2016 John owns shares of NSANY, RIG, MGX, PGI, TRTN, NE, and ANTX. When possible he has also sold covered calls on these same securities.
Data is from morningstar.com.

by John | Dec 4, 2016 | Capital Appreciation, Insurance, Personal Journey, Saving Money, Value Investing, Wealth Protection
“We teach about how to drive in school, but not how to manage finances.” – Andy Williams
I didn’t learn much about personal finance or how to build wealth in school.
Even though I find art history, World War II, and the Pythagorean theorem interesting and important areas of study–I can think of few topics with more day to day relevance than personal finance.
But if it weren’t for two finance electives I took in college I wouldn’t have learned anything about personal finance in school.
There are powerful wealth lessons that schools could teach but for some reason do not.
Five Powerful Wealth Lessons School Didn’t Teach
1) I must Produce more than I consume to Build Wealth
I can’t say it better than Simon Black:
The Universal Law of Prosperity is very clear– in order to build wealth you have to produce more than you consume. – Simon Black
Source: https://www.sovereignman.com/trends/this-entire-system-is-rigged-against-your-prosperity-18760/
This basic concept isn’t taught in school and as a result we get polls like: “Two-thirds of Americans would have difficulty coming up with the money to cover a $1,000 emergency.”
Source: http://apnorc.org/news-media/Pages/News+Media/Poll-Two-thirds-of-US-would-struggle-to-cover-$1,000-crisis.aspx
The United States can also boast the following numbers:
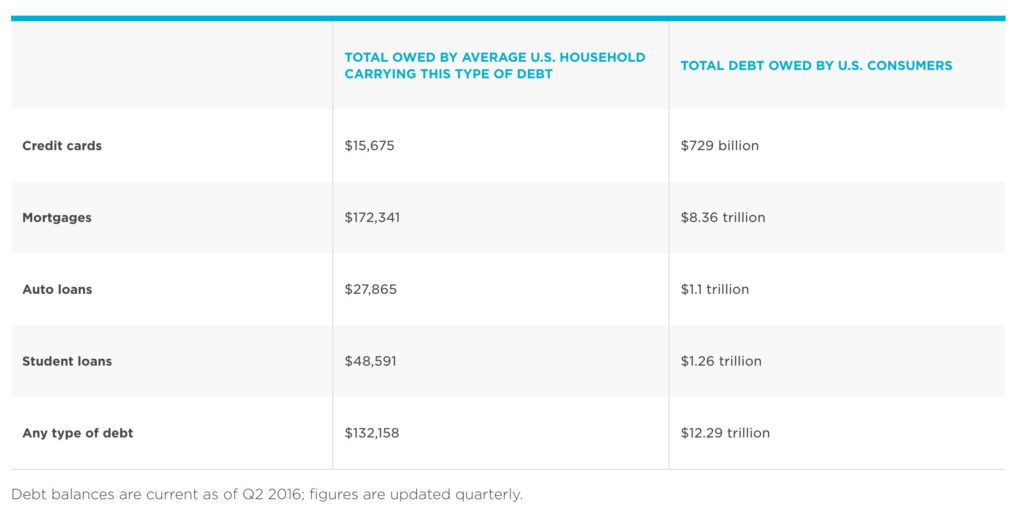
Source: https://www.nerdwallet.com/blog/credit-card-data/average-credit-card-debt-household/
If you consume more than you produce, the only option is to go into debt, which is a sure way to become poor.
In school I never learned the powerful wealth lesson: I must Produce more than I consume to Build Wealth.
2) Money Loses Value Because of Central Banks
I think most people KNOW that money loses value (or at least that things are getting more expensive each year), but for anyone who disagrees here are some facts:
- In 1950 a new house cost $8,450 in 2016 the average is over $300,000 (3,450% increase)
- In 1950 a gallon of gas was 18 cents in 2016 it is $2.40 (1,233% increase)
- In 1950 the average cost of new car was $1,510.00 in 2016 it is $33,560 (2,122% increase)
- In 1950 the average income per year was $3,210 in 2016 it is $55,000 (1,613% increase)
Source: http://fuelinsights.gasbuddy.com/content/docs/2016forecast.pdf
Source: www.thepeoplehistory.com/1950s.html
Source: www.deptofnumbers.com/income/us
Source: www.usatoday.com/story/money/cars/2015/05/04/new-car…price-3…/26690191/
Those are stats specific to the United States but I know you’d find similar statistics throughout the world.
Dollars (and other fiat currencies) are losing value. Incomes are not keeping up with the rising costs of homes and automobiles, the two major types of purchases many people will make.
Saving money in dollars is a sure way to get wiped out.
Money doesn’t lose value because of some mysterious force or greedy businesses, it loses value because of central banks. This is something I’m passionate about because it is simply robbery. Not only is price inflation robbery, but it most directly harms the poor. I’ve written about the Downfall of the US Dollar and What Causes Inflation.
In school I never learned the powerful wealth lesson: Money Loses Value Because of Central Banks.
3) I’m on my Own for Retirement
In over 18 years of education in US government schools I can’t recall ever learning about the failure of US government programs.
There are countless examples.
One is state public pensions. They are woefully underfunded. Alaska, California, and Illinois are some of the worst offenders when it comes to underfunded pensions.
However, all fifty of these United States plus the District of Columbia suffer from underfunded public pensions.
Source: http://www.zerohedge.com/news/2016-12-02/stanford-study-reveals-california-pensions-underfunded-1-trillion-or-93k-household
Two more in-progress failures are Social Security and Medicare. (To be fair, I did learn about the insolvency of these programs in FIN 232, my senior year of college.)
The Medicare Trustees’ report indicates the Medicare program is underfunded and revenue is less than expenditures.
Source: https://www.cms.gov/Research-Statistics-Data-and-Systems/Statistics-Trends-and-Reports/ReportsTrustFunds/index.html?redirect=/reportstrustfunds/
The Social Security Trustees’ report indicates that Social Security is underfunded as well.
Source: https://www.ssa.gov/oact/tr/
This isn’t some tin-foil hat conspiracy. Below is a direct quote (from 2015) from the Social Security and Medicare Boards of Trustees:
Social Security’s Disability Insurance (DI) Trust Fund now faces an urgent threat of reserve depletion, requiring prompt corrective action by lawmakers if sudden reductions or interruptions in benefit payments are to be avoided. Beyond DI, Social Security as a whole as well as Medicare cannot sustain projected long-run program costs under currently scheduled financing.
Source: https://www.ssa.gov/oact/TRSUM/2015/index.html
I never learned about the importance of saving for retirement in school. I never learned about investing, IRAs, 401ks, pensions, or Health Savings Accounts. (Again, I did learn about these in FIN 232, my senior year of college.)
If you’re under 40 and you live in the US and you think you can count on Social Security and Medicare (or a public pension) I think you’ll be in for a rude surprise.
Social Security and Medicare are broken. Plain and simple. “But politician X will save these programs!” you might be tempted to think.
Here is another quote from the above report:
“Social Security and Medicare together accounted for 42 percent of Federal program expenditures in fiscal year 2014.”
This is the same Federal Government that is $20 trillion in debt. If the US Federal Government bails out Social Security and Medicare, who is going to bail out the Federal Government?
People need to make their own preparations!
In school I never learned the powerful wealth lesson: I’m on my Own for my Retirement.
4) College Isn’t Right for Everyone

Will this guy have to go $200,000 in debt to get a degree in British Literature?
How many times have you heard something to the effect of: “Study hard, go to college, get a good job and then retire at age 65.”?
That approach CAN work, but high school seniors need to be asking themselves, “does it make sense to go $150,000+ in debt for an art history degree?”
I took an art history class in college and I really enjoyed it. But if I knew how much I was paying for that class I would probably have done a lot better going to a museum or buying a few books.
If, for example, you can get a chemical engineering degree for $100,000 and are then able to make $70,000 per year right out of college then it starts to make more sense. But people need to start making those cost benefit and ROI calculations.
Young people need to stop assuming that college is a good idea. It depends on the cost of the education and how much that degree will allow you to earn once you graduate.
In school I never learned the powerful wealth lesson: College Isn’t Right for Everyone.
5) There is a Difference between Good Debt and Bad Debt
 There is good debt and there is bad debt.
Taking out a $35,000 loan to buy a brand new car is very expensive. Maybe you’re making enough money that you can afford to treat yourself to a new car every 2-3 years and maybe leasing an automobile makes sense in that case.
But a good used car that is 5-6 years old makes a lot more financial sense particularly if you aren’t making a lot of money.
On the other hand, taking out a $200,000 loan to buy an income producing rental property could make a lot of sense.
Taking out a loan to buy new shoes or a car or other consumable items is bad debt.
Taking out a loan to buy an income producing asset is good debt.
In school I never learned the powerful wealth lesson: There is a Difference between Good Debt and Bad Debt.
I Learned a lot about Personal Finance outside of School
I learned a lot about personal finance from my parents, by reading, talking to experts, attending seminars and trial and error. In some ways it’s a good thing I didn’t learn about personal finance in school because I probably wouldn’t have learned as much and most likely would have been taught things that aren’t true that I would have had to unlearn.
The important takeaway is that financial education is critically important and that it’s up to YOU to make sure you learn what you need to know.

by John | Nov 13, 2016 | Capital Appreciation, Geopolitical Risk Protection, Value Investing, Wealth Protection
In what was largely a surprise Donald Trump was elected the 45th president of the United States last Tuesday.
His most ardent supporters no doubt believe he will “make America great again” and his opponents feel as though the world has come to an end. While I won’t say that elections don’t matter there are several problems that won’t be solved, irrespective of who was or was not elected.
HowIGrowMyWealth.com caters to a global audience and because the United States is one of the top two largest economies in the world US politics and issues can have a far reaching impact on the global economy.
Government Insolvency
United States national debt is $19.1 trillion. The total debt-to-GDP ratio is 109% and has been rising. This means that United States is taking on more and more debt with less and less GDP growth to show for it.
Source: https://en.wikipedia.org/wiki/National_debt_of_the_United_States
Foreign central banks, whom the United States have been able to export inflation to in the past, have become net sellers of US treasuries.
Source: http://money.cnn.com/2016/02/17/news/economy/china-us-debt-dump-central-banks/
Neither candidate placed emphasis on reducing the debt. If Hillary was elected and raised taxes and regulations but didn’t cut spending that would slow the economy and reduce tax revenues (even at a higher rate) and the US government debt would grow.
Tax revenue in the US has never gotten above 13% of GDP anyway. So even if you wanted to grow government revenue, the best and only way to do so is to grow the economy.
Source: http://data.worldbank.org/indicator/GC.TAX.TOTL.GD.ZS?locations=US
If Trump lowers taxes and regulations that would grow the economy but not enough to pay for the out of control government spending. And since Trump in no way emphasized reducing government spending that will also cause the national debt to grow.
No candidate discussed both cutting spending and reducing taxes–which is what it would take to reduce the debt.
The continued expansion of debt in the US is unsustainable. I don’t think the US will do a traditional default on debt. The debt will most likely be reduced via monetization, which will destroy the value of dollars.
With international purchases of US debt in decline, and no political will for the US government to reduce spending, only the US Federal Reserve will be in a position to step in and purchase US debt.
Social Security and Medicare Insolvency
Social Security and Medicare face serious budget shortfalls according to the trustees of these programs.
Source: http://www.wsj.com/articles/social-security-medicare-trust-funds-face-insolvency-over-20-years-trustees-report-1466605893 Note: if you search for this article on google and click on it through the search engine you can access the full article even if you are not a WSJ.com subscriber.
Not only that but they account for a large portion of US government spending and hence add to the debt. The above cited WSJ article states, “Medicare and Social Security accounted for 41% of federal spending last year, up from 36% in 2011.” Proposing any change to Social Security that would reduce benefits or control costs is taboo in American politics so the issue will continue to grow worse until it blows up completely.
Candidate Trump has vowed to save social security and did not discuss any type of cuts or raised retirement age. Candidate Hillary held basically the same position.
Source: https://www.hillaryclinton.com/issues/social-security-and-medicare/
US Stock and Bond Markets are in a Bubble
I’ve written about how US Stocks and Bonds are in a Bubble. While I can say with certainty that US stocks and bonds are overvalued based on fundamentals and historical precedent I can only guess when these bubbles will burst. However, I think it is likely that President Trump will encounter a large stock market correction and perhaps a dollar crisis during his first (and maybe only) term. This day of reckoning can only be delayed not prevented.
Whichever political party is in control when the bubble bursts will be blamed. However, a bi-partisan coalition of Democrats and Republicans in both congress and the presidency, fueled by a reckless US Federal Reserve, have over the past few decades caused this problem and are responsible for the stock market and bond bubbles.
It would be best if the bubbles popped sooner rather than later. That would result in shorter term pain but it would be very beneficial in the long term.
But whoever is in power will always have the political incentive to delay the pain, which only makes the inevitable pain even greater when it does come to pass.
If the stock market does crash the Federal Reserve will do the few things it can do: lower interest rates and buy assets with printed money. With already historically low interest rates the Federal Reserve will likely resort to more quantitative easing, asset purchases and perhaps even negative interest rates.
Regardless of who had been elected these issues are not going away and even though the out of power party will blame the in power party; the reality is both are to blame.
Opportunity
Despite the huge challenges in store for the United States that would likely spill over into the global economy I’m very optimistic. There are practical steps I’m taking to prepare for these trials.
I’ve written about them on HowIGrowMyWealth.com for months. You can buy gold to protect yourself from a dollar crisis. I buy physical bullion but I also buy gold through Goldmoney.
I’ve written about how I keep a month’s worth of income in physical cash in the event there are capital controls or negative interest rates.
I’ve also written about investing in value-oriented foreign stocks and what metrics I use when evaluating a stock.
I think gold and select foreign stocks provide incredible value at this time and with the dollar unjustifiably strong now is a great time to trade dollars for better assets.
Politicians make a lot of promises and try to inspire hope in exchange for votes. If they are successful in doing good things then that would be a nice change but it is important to make preparations on your own. The problems the US faces are too big for one person to solve and if you put your hope in a politician or government you’re bound to be disappointed.
by John | Nov 6, 2016 | Capital Appreciation, Value Investing, Wealth Protection
You don’t get average returns when you make an investment. This is a very important concept. The reason it is important is that most mutual funds and ETFs will list average returns, but as an investor you never get the average return.
Simple Example
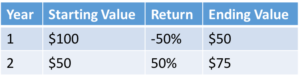 Let’s illustrate this point with a simple example. Lets say you invest $100 and the investment loses 50% in year 1. Then in year 2, the investment goes up 50%.
Your average return is 0%.
But how much would the investment be worth?
Before I understood average returns I would have said $100. But the correct answer is $75. In order to get back to $100, after a 50% loss in year 1, the investment would need to go up by 100% in year 2.
What would it look like if you Did get the Average Return?
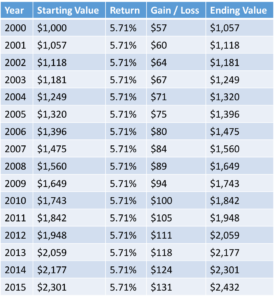
The average return of the S&P 500 between 2000 and 2015 was 5.71%.
Source: http://pages.stern.nyu.edu/~adamodar/New_Home_Page/datafile/histretSP.html
 But if you invested in the S&P 500 during that same timeframe you would not get the returns of 5.71% compounded annually.
If you got 5.71% interest each year, and you invested $1000 at the beginning of the year in 2000, by the end of the year in 2015 your $1,000 would have grown to $2,432.
This illustrates the power of compounding interest over time. Over 15 years this theoretical investment went up 143%.
However, an actual $1,000 investment in the S&P 500 would NOT have gone up this much.
The Return You Would Actually Get
I would love it if I invested $1,000 and it was worth $2,432 15 years later.
But that is not how much your investment would be worth if you invested $1,000 in the S&P 500 on 1 January 2000 and sold on 31 December 2015. Your $1,000 would be worth $1,877.
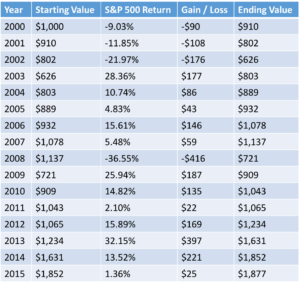 The reason being that if an investment goes down, as the S&P 500 did 4 out of the 15 years during this period, it must go up by even more to make up for the losses.
It’s also worth noting that in order to get the $877 gain one would have to have held onto the investment through three consecutive years of losses over 9% and a 2008 drop of over 36%.
That would take an iron will.
The typical human reaction when faced with such losses is to sell to avoid further losses.
Why does the Financial Industry Use Average Annual Return?
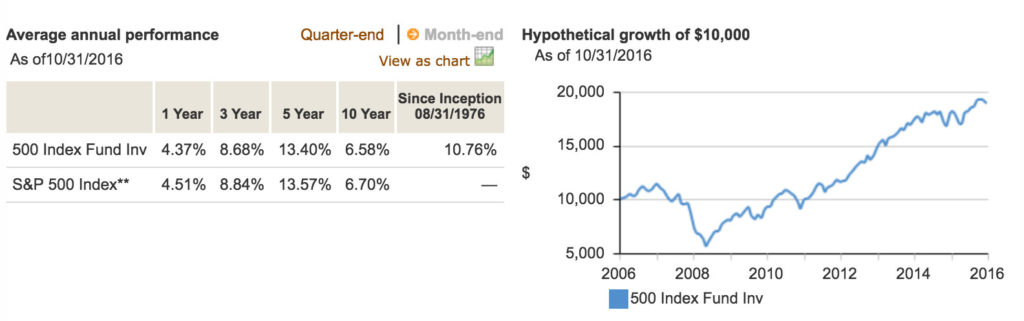
The Vanguard 500 fund (VFINX) lists a 6.58% average annualized return over the past 10 years. If you really got 6.58% compounded each year the investment would roughly double in ten years, but this fund only went up about 50% over that timeframe.
The main reason the average annualized return is used is probably because it makes the return of a fund look better than it actually is. Compound Annual Growth Rate (CAGR) would be a more useful and frankly honest metric because that is the rate an investor actually gets.
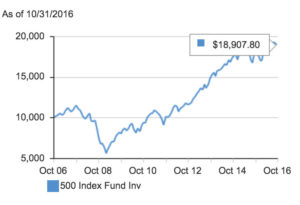 I’m not trying to single out Vanguard. I think Vanguard is a good company but average annual performance is deceptive. And the chart on the right showing the hypothetical growth of $10,000 is also deceptive.
Source: https://personal.vanguard.com/us/funds/snapshot?FundId=0040&FundIntExt=INT
Why does it need to be hypothetical? We know exactly how much $10,000 invested in the VFINX in 2006 would be worth today. In October 2006 VFINX was trading at 122.62 and in October 2016 it was trading at 196.54. So a $10,000 investment would result in a gain of $6,028 for a total value of $16,028. But Vanguard lists the gain as $18,907.80 which would only be the case if this fund returned 6.58% compounded annually with no losses.
How Much Gain is Required to Recoup a Loss?
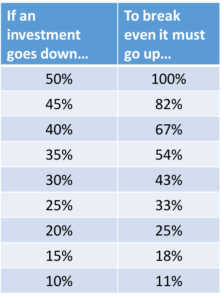 The problem with losses is that when trying to make them up and get back to even you are doing so with less money.
Not surprisingly, the greater the loss, the greater the gain needed to make it up. With smaller losses the gain only has to be slightly larger to get back to break even. However, with larger losses, higher and higher multiple gains are needed to recoup the losses.
The moral of the story is that 1) you won’t get the average return for an investment, so when you see an average return listed for an ETF or Mutual fund, you can ignore it, it’s not a useful number 2) when an investment goes down in value, it is costly.

by John | Oct 2, 2016 | Capital Appreciation, Value Investing
Warren Buffett is known as a value investor. He’s been very successful so I looked at the fundamental indicators and metrics of his most profitable purchases to see if the metrics I use would have led me to purchase the stocks Buffett did.
What I found was that the six metrics I use when choosing a value stock are consistent with Buffett’s purchases.
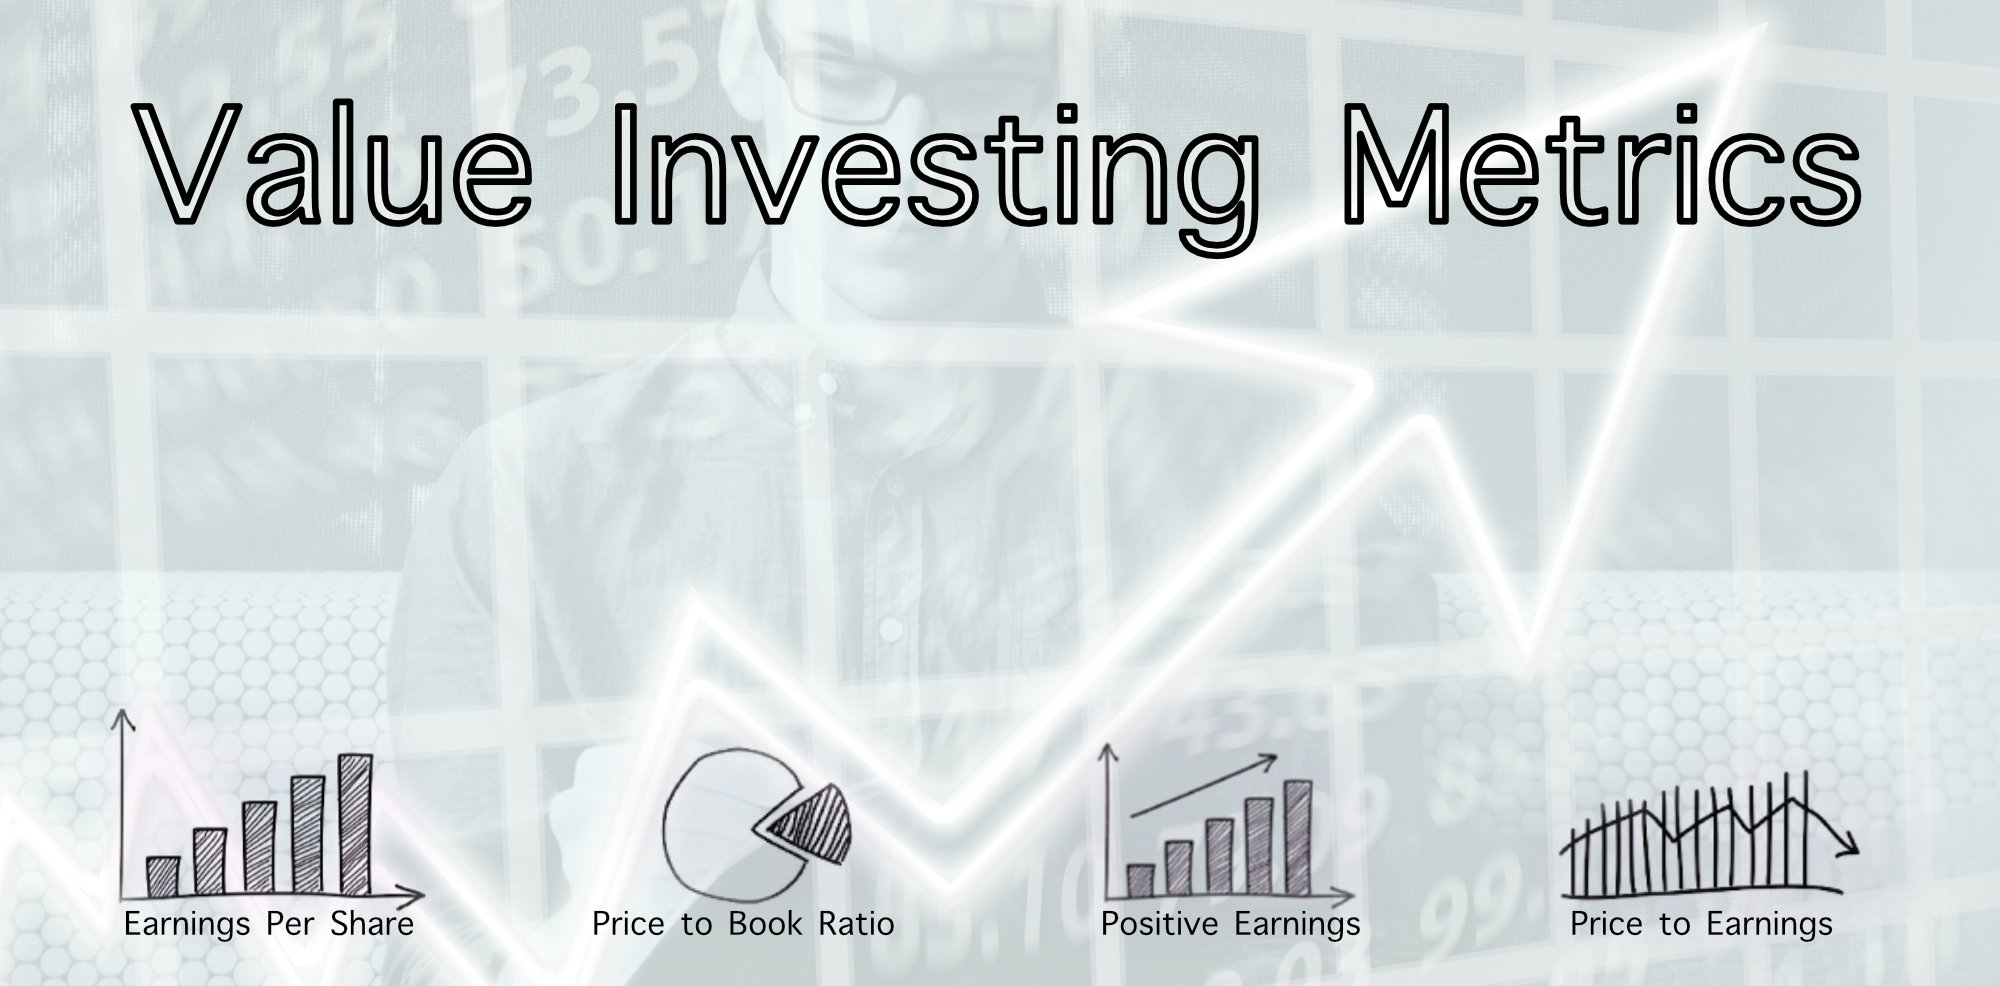
By way of background, here are the six Value Investing Metrics I use:
- Price to book of less than 1 (can go up to a PB of 1.5)
- Price to earnings less than 15
- Positive Cashflow
- Positive Earnings per share
- Return on equity greater than 8% on average per year
- Dividend Yield
Wells Fargo (WFC)
Total return: 9,417%
Buffett started buying Wells Fargo stock in 1990. At the beginning of the year, the P/B was 1.668 and by the end it was 1.379, for a rough estimated P/B ratio of 1.5. Using similar tactics We find the metrics for Wells Fargo around the time Buffett was buying up shares:
- Price to book: 1.5
- Price to earnings: 8
- Cashflow: 1.668 billion
- Earnings per share: $.3450
- Return on equity: 19.52%
- Dividend Yield: 4%
Source: ycharts.com
PetroChina (PTR)
Total return: 720%
Buffett bought this Chinese stock in 2002-2003 and sold in 2007.
- Price to book: Data not available
- Price to earnings: 6
- Cashflow: 1.668 billion
- Earnings per share: $3
- Return on equity: 15.41%
- Dividend Yield: 7.5%
Fundamentals in 2007:
- Price to book: 3.194
- Price to earnings: 17
- Cashflow: 26.83B from operations
- Earnings per share: 10.64
- Return on equity: 23%
- Dividend Yield: 3%
It’s interesting that the price to book was relatively higher than a traditional value stock. The dividend yield had fallen and both cashflow and earnings per share had expanded tremendously.
His decision to sell PTR would likely also have factored in management, industry climate and political optics. To that last point, he may have wanted to pivot from an oil company to an electric car company because of the long term prospects and that it is more consistent with what democrats in the US find acceptable.
Source: ycharts.com
BYD (BYDDF)
Total Return: 671%
Buffett bought this Chinese electric car maker in 2008. I had trouble finding historical stats for BYD. The following BYD stats are based on this article and the 2008 financial report.
- Price to book: 2.5
- Price to earnings: <8
- Cashflow: $273 million (converted from RMB1,816,362)
- Earnings per share: $.08 (converted from RMB0.50
- Return on equity: ???
- Dividend Yield: none in 2008 but did pay a dividend in 2007
Source: http://bydit.com/userfiles/attachment/2009042009130534224.pdf
The price to earnings ratio is certainly attractive and the company is cashflow positive. The price to book is rather rich but a large factor in this purchase was probably the endorsement of Buffett’s right hand man, Charles Munger:
In 2008, Munger sold Buffett on Chinese car battery company BYD by saying that its CEO, Wang Chuan-Fu, was quite obviously a descendant of both Thomas Edison and Jack Welch. He solves problems like Edison and gets things done like Welch, Munger said. “I’ve never seen anything like it in my life.”
Source: http://fortune.com/2014/10/31/warren-buffett-best-investments/
Coke (KO)
Total Return: 1,600%
Buffett is famous for owning Coke. He started buying the stock in 1987. I found an insightful article on why Warren Buffett bought Coke in 1987. Coke wasn’t a value stock by traditional metrics.
Coke was selling around 15 times earnings and I believe somewhere around 5 times book value at the time.
Source: http://basehitinvesting.com/mohnish-pabrai-heres-why-buffett-bought-coke-ko-in-1987/
Buffett instead looked at the value of the brand and determined that it would cost $100 billion to build a similar brand and that Coke was undervalued since the whole company could be purchased for $20 billion.
He also started buying it in the same year as the 1987 stock market crash, putting into practice his adage: “We simply attempt to be fearful when others are greedy and to be greedy only when others are fearful.”
It’s a great example of how the value investing metrics are important, you can still be successful without them if there is an overarching larger reason why the stock is relatively undervalued.
Berkshire Hathaway (BRK.A)
Total return: 1,745,300%
Buffett bought this new england textile company in 1965 and used it as a holding company by the same name. I found some stats in this article.
- Price to book: .76
- Price to earnings: 7
- Cashflow: yes
- Earnings per share: Start of year: $3.7
- Return on equity: ???
- Dividend Yield: yes
A Proven Strategy
Value investing is a proven strategy. While there are few guarantees in life or investing it is no coincidence that one of the world’s most famous investors and wealthy investors is a value investor.
For a current list of the value stocks I like, click here.
by John | Sep 25, 2016 | Capital Appreciation, Passive Income, Preservation of Purchasing Power, Value Investing
Value investing is a way to bring intelligence back into stock selection.
Everyone loves a great deal when they’re shopping but for some reason that love does not transfer when shopping for stocks. Many retail investors tend to buy expensive stocks as they are getting more expensive.
They pile into trendy growth stocks like Twitter and Netflix.
It doesn’t make sense.
Making money in stocks can be done in just two ways:
1) buying low and selling high
2) dividends
Because many investors like to buy expensive stocks with no dividend the prevailing strategy has become “buy high, sell higher”.
This could work some of the time but if you buy stocks at all time highs (like many are now) who are you eventually going to sell them to? You’d have to find someone else who wants to buy them at an even higher price or sell them at a loss.
Buying overpriced stocks also leaves a person much more vulnerable during a stock market correction as was experienced by countless stock owners in 2000 and 2008.
An Intelligent Approach: Value Investing
Value investing takes that same desire to find a bargain while shopping and applies it to stock selection.
Value investing is purchasing the shares of quality companies trading at a discount.
In other words, you’re buying stock in a company that is undervalued. This creates a margin of safety and built-in downside protection. It’s a way of increasing the odds that you are buying a stock low so you can sell it higher later (or so you can hold it and collect the dividends).
Is Value Investing just buying Cheap Stocks?

Cheap lawn chairs tend to collapse when you’re sitting in them
Value investing isn’t buying cheap stocks. Value investing is buying high quality companies at a price below their book value.
You can find a deal on a high quality lawn chair and pay less than you would for a lower quality, more expensive lawn chair. The key to spotting a bargain is to know what to look for. Fortunately, there are a number of indicators (or metrics) one can look at to determine if a stock is both low cost and high quality.
What indicates a stock is a Great Value?
[Note from John, 5 Feb 2017: While the principles of value investing are timeless I have since started looking at Better Metrics for Value Investing.]
The metrics I look at are as follows:
- Price to book of less than 1 (can go up to a PB of 1.5)
- Price to earnings less than 15
- Positive Cashflow
- Positive Earnings per share
- Return on equity greater than 8% on average per year
- Dividend Yield
I’ll break down each one below.
Price to Book
The Price to Book ratio is calculated by taking the companies’ market capitalization and dividing it by the companies’ total assets minus total liabilities. A low price to book could indicate that a stock is undervalued.
If the P/B is below 1 that means if the company’s assets were liquidated and the stockholders were paid out in cash they would get more than what they paid for the stock.
Price to Earnings
The historical average for the stock price to earnings ratio is 15. The current PE ratio for the S&P 500 is around 25. By purchasing stocks with a PE less than 15, you’re ensuring the company’s price to earnings is below the historical average. It’s another indicator of value.
Source: http://www.multpl.com/
Positive Cashflow and Earnings per Share
A low price to book by itself could indicate that a stock is undervalued or that the company is on shaky ground. Positive cashflow and positive earnings per share means that the company is making money. The higher the EPS the better all else given.
Return on Equity
A return on equity of 8% or more over a period of years indicates the company consistently produces value to shareholders. It’s another way to ensure the company is healthy and is not undervalued due to a fundamental issue with the performance of the business.
Dividend Yield
This is the second way to make money on a stock. If a company provides a yield that means the investor is being compensated for holding the stock while waiting for the undervalued equity to revert to a more fair valuation.
Does Value Investing Work?
Value investing was pioneered by Benjamin Graham. You may never have heard of Benjamin Graham but it’s likely you’ve heard of Graham’s most successful student, Warren Buffett.
The investing principles Buffett used to grow his wealth were developed and taught by Benjamin Graham, the father of value investing.
Value investing is the way Warren Buffett became one of the richest men alive.
Getting Started in Value Investing
You can look for stocks that meet the criteria I’ve discussed above and purchase them individually.
Another option is to buy a value index fund. A a passive index fund takes little research and is theoretically lower risk.
An example of such a fund is the Vanguard Value Index Fund (VIVAX). The problem I have with funds like this is that the stocks in the fund aren’t the best values. For example, the largest holding in VIVAX is Microsoft (MSFT).
MSFT has a price to book of 6.2 and a price to earnings of 27.4. The other major holdings of VIVAX like Exxon Mobil and GE follow a similar story.
Microsoft and Exxon are quality companies but at these prices they don’t represent the extremely high value stocks I’m interested in.
Value investing like all investing is not without risk. But I believe taking the time to research undervalued stocks that present exceptional value is worth it.
Intelligent Research on Value Stocks
For a passive and defensive investor, value investing through index funds is fine. However, I believe an enterprising investor willing to dive deeper can make even better returns. But not everyone has the time or resources to research stocks that meet the criteria of a quality value stock.
I maintain a list of the stocks I like, access it fr-ee here.
Find An Edge
An Edge: a quality or factor that gives superiority over close rivals or competitors.
It’s hard to make money on stocks like Apple or Microsoft that have dozens of analysts following them, where virtually everything is known about the stocks, and which are traded at high frequency by Wall Street computer algorithms.

If you don’t know what your edge is you don’t have one.
I also think that there are exceptional values outside of the standard US stock exchanges.
I’m particularly fond of the Australian Securities Exchange because it is outside the Wall Street bubble but still a stable jurisdiction. My free report lists two brokers that will allow you to trade stocks in the land down under.
Wisdom from Benjamin Graham
I close this article with a quote from the Father of Value Investing:
“…the real money in investment will have to be made–as most of it has been in the past–not out of buying and selling but of owning and holding securities, receiving interest and dividends and increases in value.” – Benjamin Graham from The Intelligent Investor