Back when I was an impressionable college student I was shown an asset allocation rubric. The rubric was a list of asset classes with a recommended percent of funds to be invested in each asset type. The result would be a diversified portfolio.
It was my first exposure to asset allocation and it made a lot of sense.
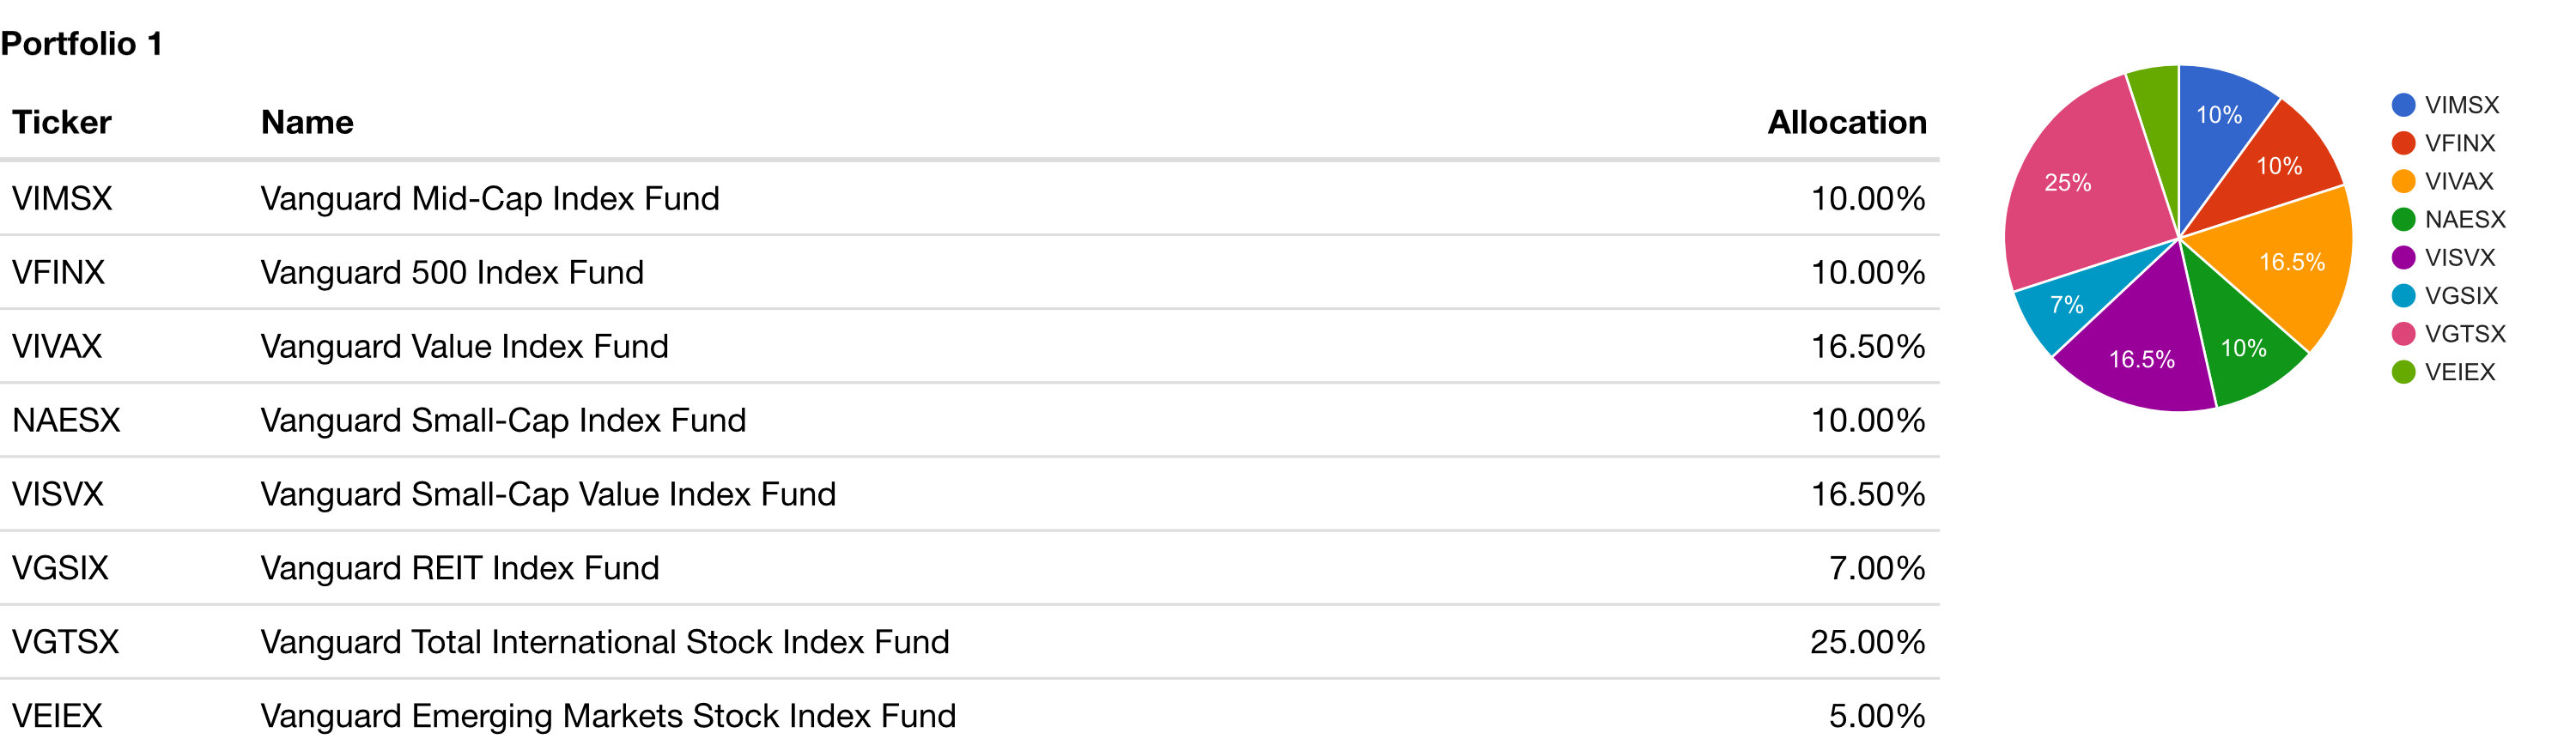
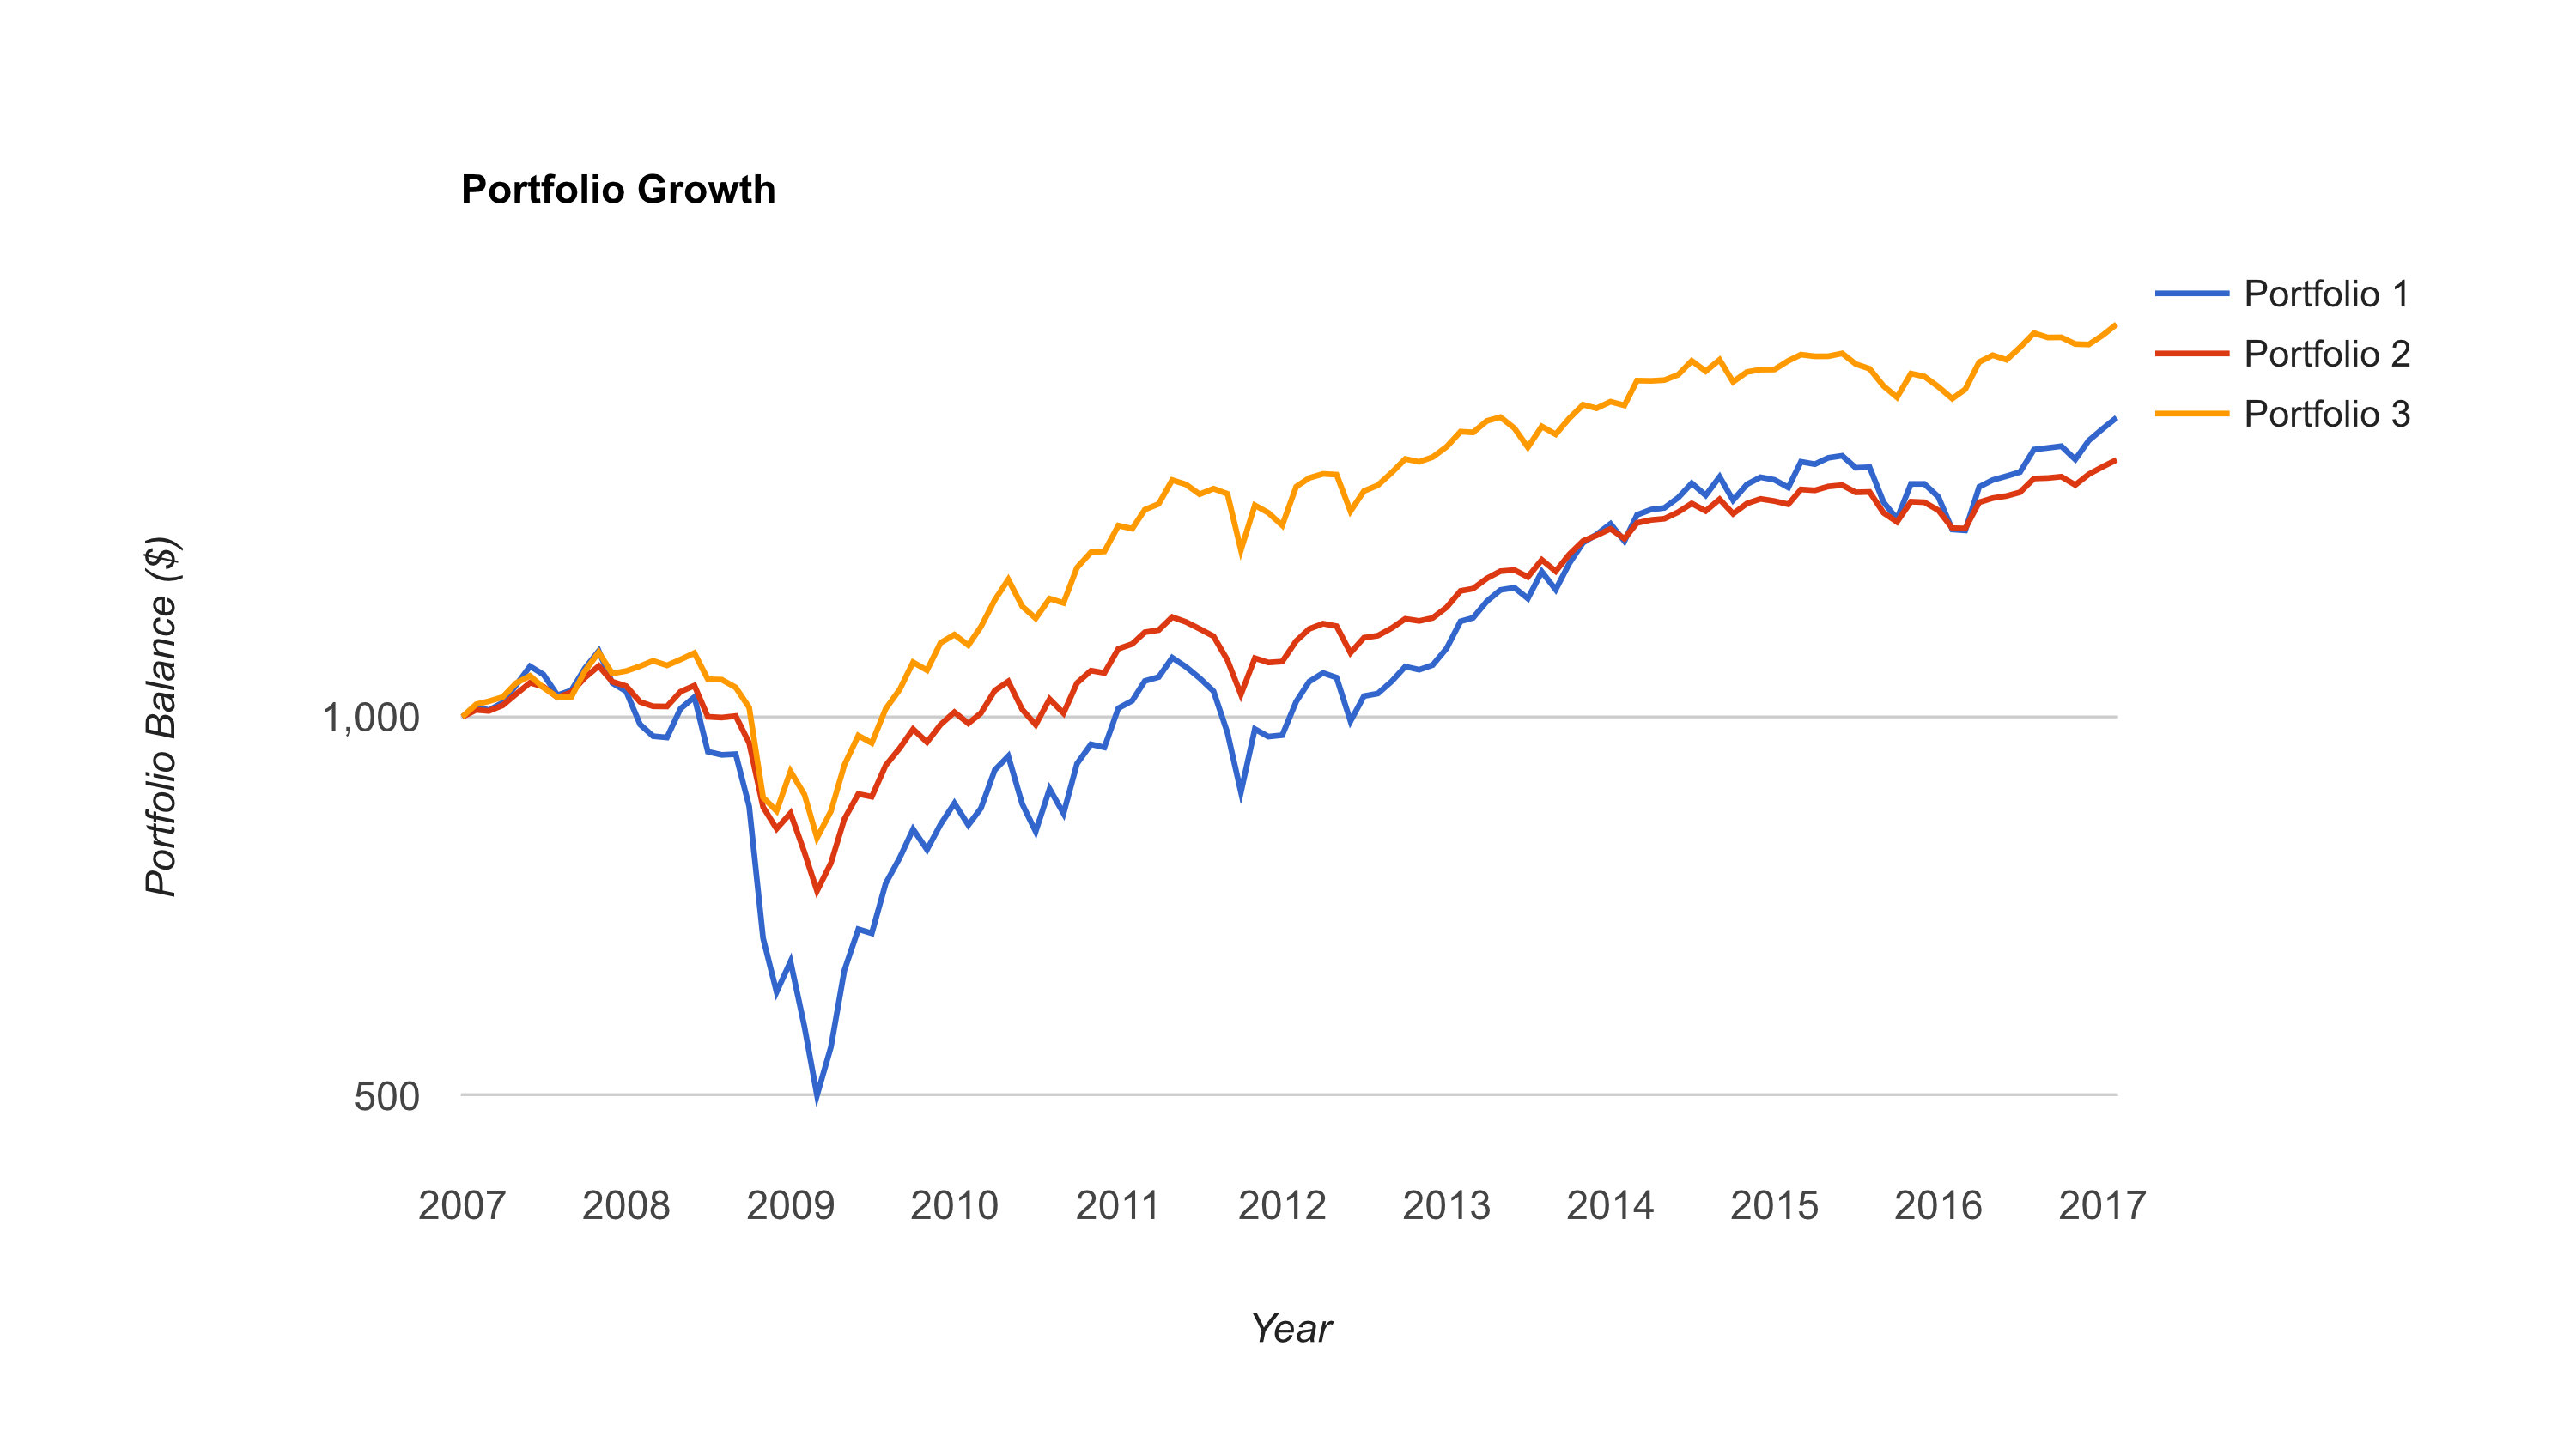
The allocation I was presented was very similar what I have listed below and I’ll call it “Portfolio 1”.
Asset Allocation Portfolio 1
The problem with this portfolio is that is dropped over 55% in the 2008 financial crisis.
Without any bonds (or gold) this portfolio was subject to a massive drawdown.
Since January of 2007 to January of 2017 this portfolio has a compound annual growth rate (CAGR) of just 5.58%.
Plus the correlation with US stocks is .98.
In fact an investor would have been better off just buying the Vanguard Total Stock Market Index (VTSMX) and calling it a day. The “Just Buy VTSMX” strategy would have had a 7.25% CAGR with a lower maximum drawdown of around 50%.
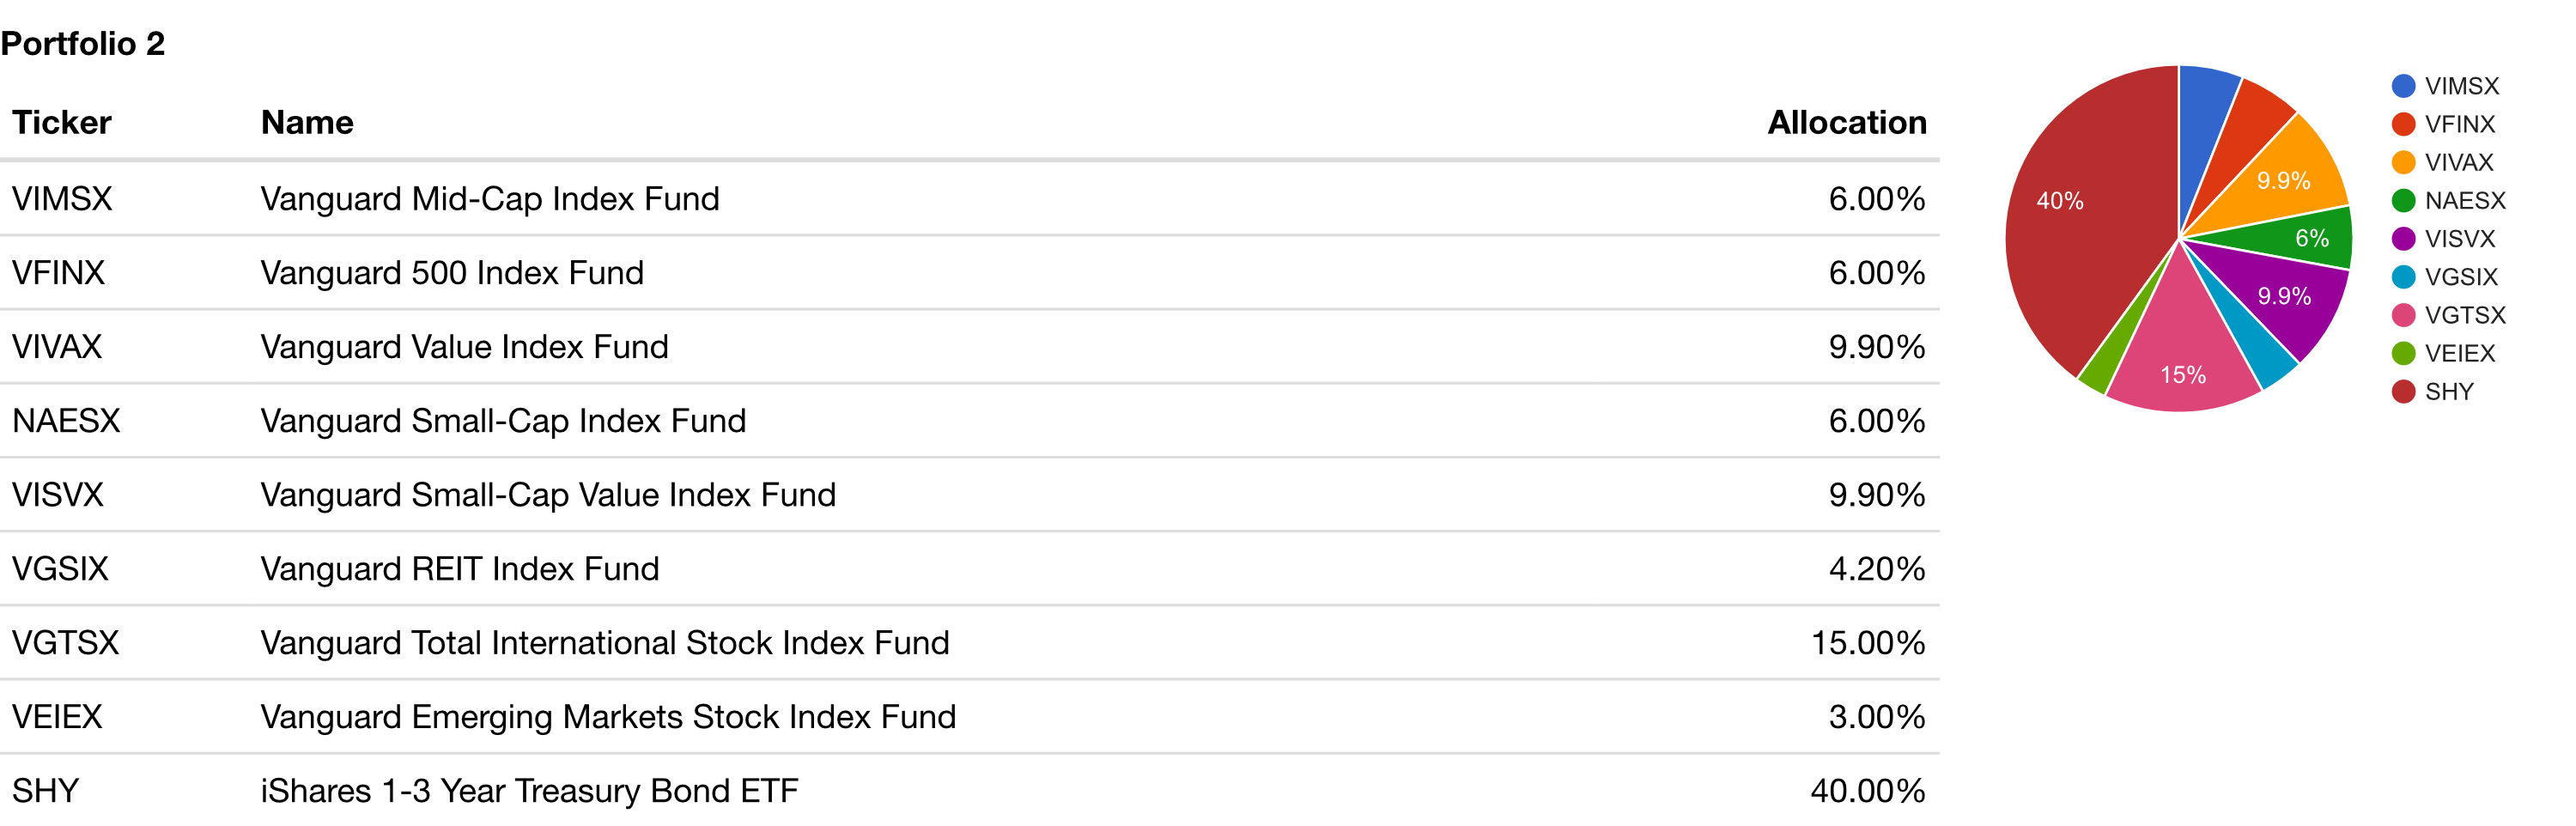
Asset Allocation: Portfolio 2 (Add Bonds)
To be fair, the allocation actually calls for a 40% allocation to short term bonds. Adding 40% bonds would have limited the maximum drawdown to a much more manageable 33.72% with a CAGR of 4.77%.
Correlation of this portfolio is still .98.
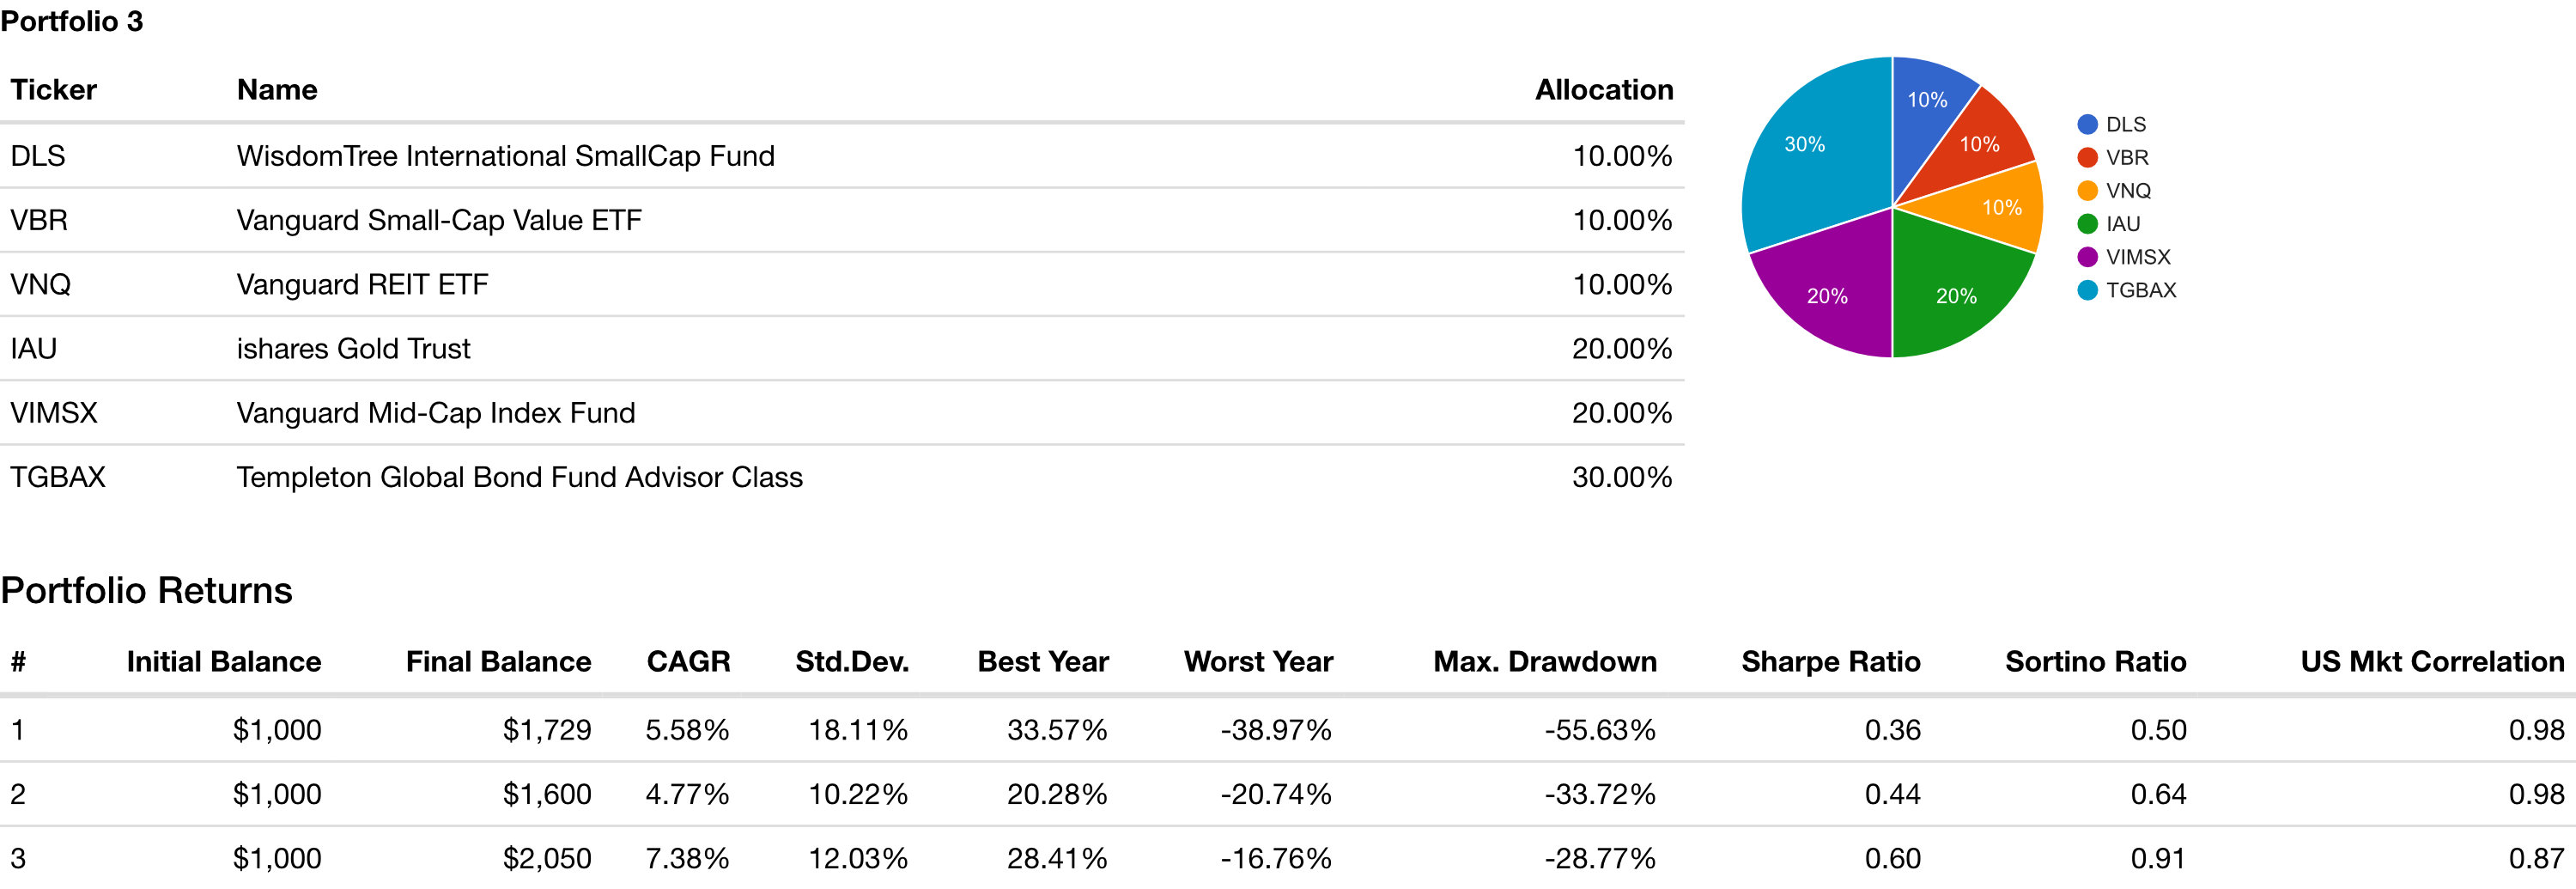
HIGMW Asset Allocation
But enduring a 33% drawdown for a a 4.77% return doesn’t seem stellar to me. So I’m been experimenting with different asset allocations using portfoliovisualizer.com.
The HIGMW Asset Allocation I’ve developed would have a maximum drawdown of 28.77% with a CAGR of 7.38%. Correlation with US stocks drops below the 90s down to .87, still high, but at least lower.
Now the actual investments in my allocation are listed below. I had to swap out some funds in order to get a sense of how this allocation would have performed in 2008.
However, many of the funds I like did not exist in 2008.
Yes, this allocation is 30% bonds. And yes, I think US stocks and bonds are in a bubble. And yes indeed I Don’t Own US Treasuries. But 20% of my allocation to bonds are outside the US and the other 10% are in a fund managed by Bill Gross mainly consisting of corporate bonds and only 6% in government bonds.
So my 30% allocation to these bond funds in no way contradicts my views on US debt.
I also allocated 20% to gold and 10% to real estate. I think if inflation does pick up (even more) these hard assets will add some resilience to the portfolio.
Small cap value stocks have outperformed over the last 45 year so I’m overweight small cap value. 10% is allocated to international small cap value stocks and 10% to small cap value stocks in the US. The 20% allocation to the First Trust Dorsey Wright Dynamic Focus 5 ETF is an interesting ETF in that it is somewhat trend following. Combine these three funds and 40% of this allocation is to stocks.
Gold doesn’t pay a dividend or yield. But until the central banks around the world stop acting like crazy people gold will remain a large part of my portfolio.
I don’t think I can be convinced that governments can continue to borrow, print and spend money without consequences.
Depending on where you get your news you might think the fossil fuel industry is going the way of the dinosaur. This combined with other factors have made investments in oil and gas companies like Exxon Mobil (XOM) and Royal Dutch Shell (RDSB) unpopular.
I’m long XOM and RDSB and I think these companies are undervalued and will produce solid returns over the next 10-20 years.
Why would I invest in these companies when oil and gas industry are dying?
The fact of the matter they aren’t dying. The demand for oil and gas is increasing. You might not guess that from the price of oil and natural gas.
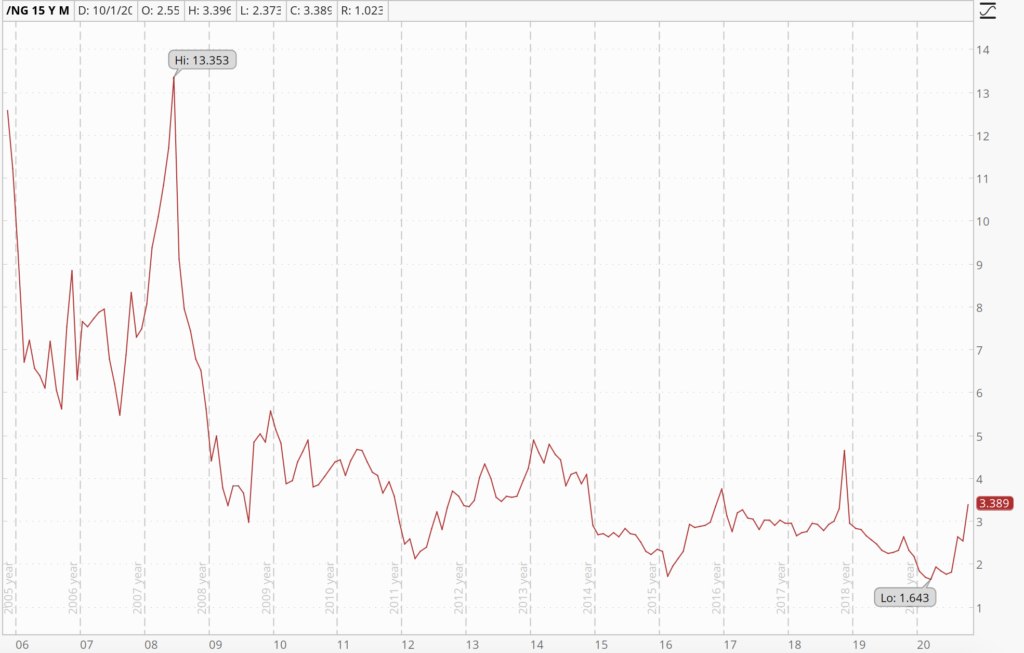
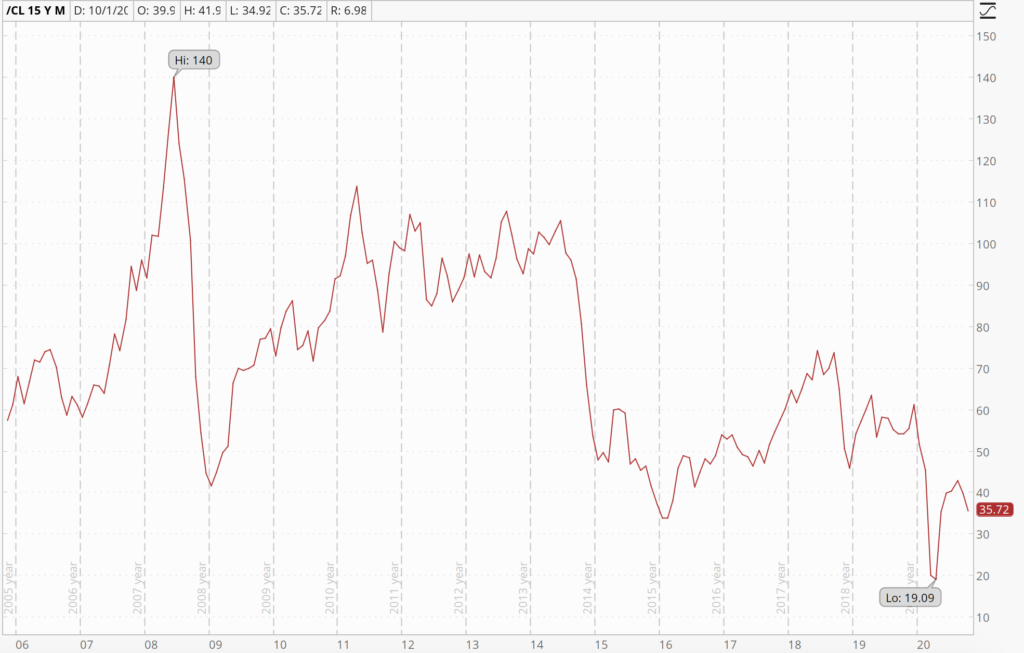
Natural Gas prices have cratered over the last 10 years Oil prices have also trended down from the 2007 high of 140
The reason for these price declines is because the supply of oil and gas is so robust. The reason I know that is because as prices are falling, consumption of oil and gas continues to increase. When supply increases faster than demand prices will fall.
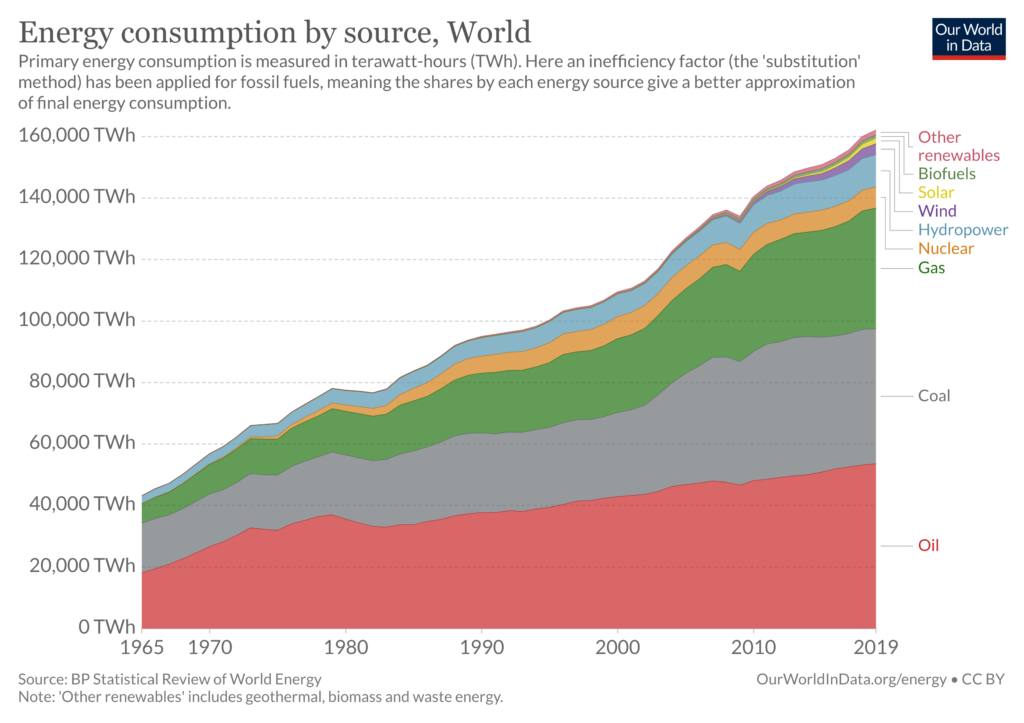
It is important thing to understand the world continues to consume more and more energy. 2009 was an exception to that rule and 2020 will be as well but the long term trends over the past 10 years and going back as far as I have data is that energy consumption keeps going up. Oil and gas consumption keeps going up as well on an absolute basis.
But the lockdown induced economic slowdown of 2020 will not last forever. Eventually the world will learn to live with the virus and the demand for energy will continue the long term trend of growth.
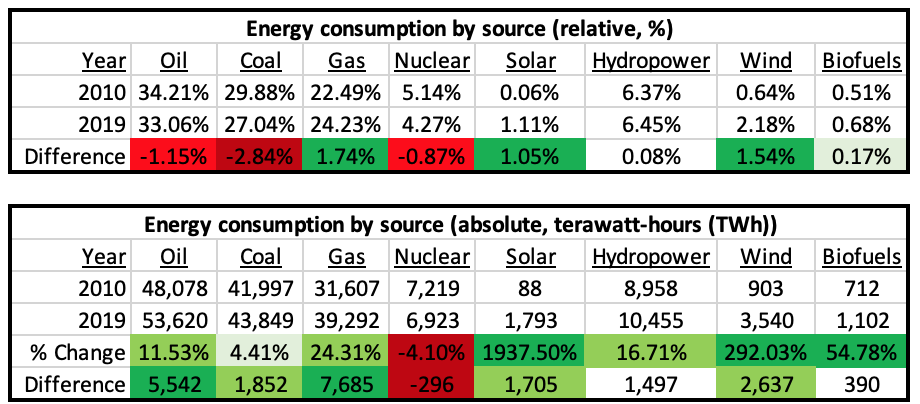
So what technology will be used to meet that demand? The trend has been an increase in energy coming from solar and wind. But they remain niche players on the global scene. As of 2019 Solar accounts for 1.11% of global energy consumption and wind accounts for 2.18%. These small industries have indeed been growing dramatically. The amount of terawatt-hours (TWh) of energy provided by solar went up 1,937.5% and wind went up by 292%.
On an absolute basis since 2010 the largest source of growth has actually been natural gas. Gas also had the largest increase on a relative basis, growing from 22.49% of energy consumption to 24.23%. However, coal and oil still remain the largest sources of energy and while they are shrinking on a relative basis they are both still growing on an absolute basis.
Date Source: https://ourworldindata.org/grapher/energy-consumption-by-source-and-region?stackMode=absolute&time=earliest..latest
The biggest loser since 2010 has actually been nuclear power. Nuclear has declined on both an absolute and relative basis. Nuclear provided 5.14% of global energy as of 2010 and has dropped down to 4.27%. On an absolute basis it has dropped from providing 7,219 TWh of energy and as of 2019 is down to 6,923 TWh. But even though nuclear energy consumption is declining, nuclear still provides more energy than solar and wind combined.
I think these trends will continue over the next 10 years. Solar and wind will continue to grow on a relative and absolute basis. But I think the relative growth they pick up will largely be from coal and perhaps in small part from nuclear unless the attitude towards nuclear technology changes. I believe natural gas will continue to grow on a relative and absolute basis. I further believe oil will continue to increase on an absolute basis but may stay relatively flat to downward on a relative basis. Coal will continue to decline on a relative basis and might even start to decline on an absolute basis as well.
Wind and solar are definitely in more of a growth mode, as you can see from those huge numbers, than the oil industry. But gas is also in growth mode. I do like alternative energy companies like Next Era Energy (NEE). While NEE is in the wind and solar space they also provide power using natural gas and nuclear. I’m looking for a buying opportunity and looking for value in the alternative energy sector as well.
But that doesn’t change the fact that oil and gas stocks are trading at steep discounts and oil and gas consumption is still in an uptrend. As billion hypocrite Warren Buffet once said be “fearful when others are greedy, and greedy when others are fearful.”
There is a lot of fear in the oil and gas industry so it might be time to be greedy.
My first value stock pick is Exxon Mobil (NYSE: XOM). Exxon has been beaten down. Demand for oil as collapsed as a result of the 2020 lockdown crisis and resultant economic contraction. It is trading near it’s March 23rd low (which was $33.11) and is currently trading at $33.50 as of writing.
I believe the demand for oil will return eventually. The oil industry is at risk from political movements in the west calling for a move away from fossil fuels but realistically oil will be used to meet global energy needs for decades to come both in the west as well as India and China. Given the metrics I think XOM is a good long term stock to own.
TTM XOM had free cash flow of -1.65 billion. In 2019 it was 5.36 billion. So while right now XOM fares very poorly when the demand for oil returns it should perform well there.
Currently 10.42% which is great. However, it is likely XOM will cut its dividend. So I’m not buying XOM for the dividend. If they keep it great but if not that is okay too.
Here is Exxon Mobil (XOM) compared to Chevron (NYSE: CVX) and Royal Dutch Shell (NYSE: RDS.B). While the other oil giants fare better on some metrics XOM has not bounced back from the march lows the way the others have.
An investment XOM is a bet that the global demand for oil rebounds. XOM is currently a good value. While it could go lower I think at a price of $33.50 it is attractive.
As always you should do your own research and make your own investment decisions. This article is not a recommendation to buy or sell a security.
As a disclaimer I own shares of XOM and could buy more in the future.
My second value stock pick will be shared with subscribers of my email newsletter.
You can look at the performance of my past stock picks.
Lithium, rare earth metals, vanadium, tungsten, palladium, and other platinum group metals are some of the technology critical materials that could be impacted by tariffs and the trade war.
For example lithium is used in lithium ion batteries, which can be found in cell phones, computers and even electric cars.
The United States and China have been trading shots, one of the latest fired by China is a rare earth metal export ban. Since the United States relies on China for somewhere around 80% of its rare earth metal imports this could cause the Americans problems.
So investing in rare earth and strategic metal miners outside of China could be a good play, as they will have a lot more business when they no longer have to compete with China.
Of course a big risk for investing based on this information is that the trade war could end peaceably and these stocks drop in value.
Largo Resources Ltd
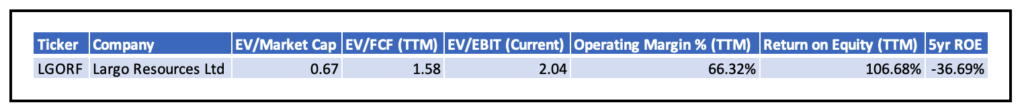
One miner I like is Largo Resources Ltd (OTC: LGORF, TSE: LGO). Among other elements Largo mines vanadium, tungsten, palladium and platinum. The stock is included in rare earth ETFs such as REMX .
Largo is cashflow positive, the enterprise value to market cap ratio is under 1, the operating margin is great, return on equity over the previous twelvemonth is stellar.
The main downsides from a value investing metrics perspective is Largo Resources doesn’t pay a dividend and has a negative 5-year return on equity.
I’ve learned from my previous picks, specifically PGI and ALO, that these small cap mining stocks can move a lot. They are risky. I rule I have for myself is to allocate no more than .25%-.5% of my liquid net worth to one of these small cap value stocks.
Disclaimer: John owns shares of LGORF and may increase his holdings in the near future.
I’ll be sharing a few of my other picks that I think will benefit from a trade war–while still being a good value even if Trump and China shake hands and make up. But I’m only sharing these picks with subscribers to my email newsletter, which you can opt-into below:
Most people aren’t willing to go back to a pre-industrial standard of living and so energy is very important. Nuclear energy is deemed too dangerous by many and solar and wind are niche players. This leaves fossil fuels.
[poll id=”5″]
Until we get Mr. Fusion to run cars and power electronics big energy companies will continue to be indispensable.
Mr. Fusion runs on old beer and banana peels. But as of writing this article, does not exist.
Big oil companies are also great for dividend investors as they tend to pay a good yield. Places like the US and Europe are highly dependent on energy imports. In 2016, Europe turns to import for 54% of its energy needs. The biggest provider of these imports is Russia when it comes to crude oil, natural gas and solid fuels.
It tends to be cold in most of Europe during the winter. The EU gets a lot of natural gas from Russia for heating purposes. The largest producer of Natural Gas in Russia is Gazprom (OTC: OGZPY).
As early as September, Gazprom could be ready to start providing 38 billion cubic meters of Natural Gas to China over the next thirty years.
Gazprom has a de facto monopoly of Natural Gas production in Russia and while this isn’t good for consumers it ensures that Gazprom will have less competition.
How does Gazprom Stack up to the Competition?
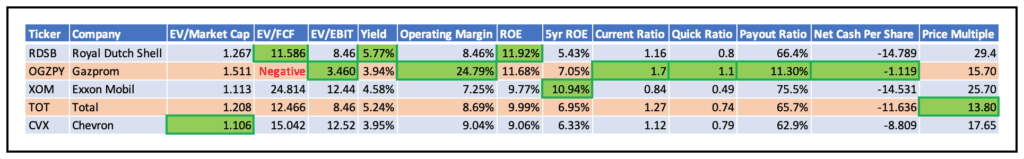
Using my value investing metrics I show below how Gazprom stacks up against some of the other energy giants.
Best in each category is highlighted in green, prices and metrics as of 19 May 2019.
The main thing that Gazprom has going against it is the negative free cash flow. The enterprise value to market cap is also the highest amongst the five stocks I’ve looked at. The trailing twelve month (TTM) operating cashflow is $24.969 billion and capital spending is $25 billion. This results in a negative $0.34 billion in free cash flow.
Gazprom’s five year average free cash flow has been $3.62 billion and they could increase free cashflow by trimming their capital spending if needed.
If I add their FCF history to the firm’s stellar operating margin, high return on equity (ROE), and financially healthy current ratio, quick ratio, and dividend payout ratio I’m willing to overlook the lack of free cashflow in the last 2 years.
Recent Price Action
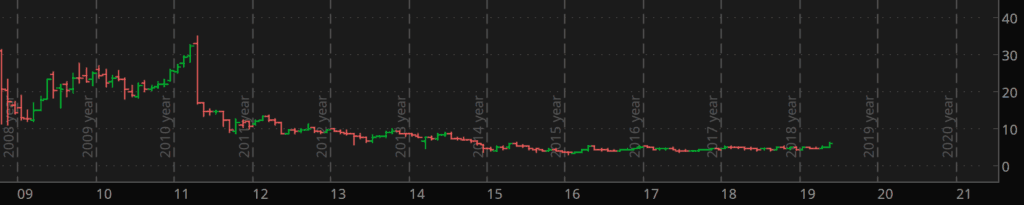
On 14 May 2019 Gazprom jumped up from around $5 to over $6 on the news management recommended increasing the dividend. This was the most price action the stock has seen in nearly a decade.
Since the 2008 financial crisis the stock price has traded sideways.
If the dividend increase falls through the stock will likely give up these gains. I don’t know how likely that is to happen or if that is even a realistic possibility.
Gazprom is the kind of boring, cashflow machine that doesn’t get a lot of attention from the mainstream but can help grow wealth.
There are geopolitical risks, however, I think being a large supplier for Europe as well as increasing the capability to supply energy to China could offset these risks.
Of course individuals need to make their own investment decisions based on what is suitable for their unique situation.
Normally you’d have to pay a lot of money for the type of in depth analysis I’m providing here on Royal Dutch Shell. Take a moment to sign up to my zero-cost-to-you spam-free email newsletter for future analysis on stocks, financial markets and alternative investments.
Overview of Royal Dutch Shell
Royal Dutch Shell (RDSb London Stock Exchange, RDS.B NYSE) is in my opinion a fantastic stock that is undervalued. It’s been profitable even in years in which oil prices were plummeting.
In an environment where traditionally safe investments are risk free reward Shell stock provides an attractive 5.86% yield. While I don’t provide personalized investment that is suitable for an individual’s unique situation I have determined that owning stock in Royal Dutch Shell makes a lot of sense for me.
When I value a stock there are a number of metrics I look at when evaluating a security:
1) Enterprise Value to Market Capitalization (EV/Market Cap)
2) Enterprise Value to Free Cash Flow (EV/FCF)
3) Enterprise Value to Earnings Before Interest and Tax (EV/EBIT)
4) Enterprise Value to Owners’ Cash Profits (OCP)
5) Operating Margin
6) Dividend Yield
7) Return on Equity (ROE)
Energy production is very capital intensive so I’ve compared Royal Dutch Shell (RDSb) to similar companies: Exxon Mobil (XOM), Total (TOT), and Chevron (CVX).
Data is from Morningstar.com as of 13 March 2018 (with the exception of EV/Owner’s Cash Profits) which is from yCharts.com as of 16 March 2018.
So how does RDS compare to other oil companies of a similar size?
1) EV/Market Cap
I like to see an EV/Market Cap below 1. Of these four energy companies none meets this criteria and RDSb is actually the highest. Total is the lowest just edging out Exxon Mobil by what amounts to a rounding error.
RDSb – 1.242
XOM – 1.134 TOT – 1.129
CVX – 1.154
Winner: Total (TOT)
2) Enterprise Value to Free Cash Flow (EV/FCF)
EV/FCF is where RDSb really shines compared to it’s peers. EV/FCF is in my view a more accurate measure than Price to Earnings (PE). The lower the Enterprise Value compared to Free Cash Flow means you’re paying less for an earnings stream.
RDSb – 19.55
XOM – 24.42
TOT – 28.99
CVX – 36.15
Winner: Royal Dutch Shell (RDSb)
3) Enterprise Value to Earnings Before Interest and Tax (EV/EBIT)
Another metric which I think is superior to Price to Earnings where a lower is better.
RDSb – 18.31
XOM – 18.57 TOT – 14.68
CVX – 26.98
Winner: Total (TOT)
4) Enterprise Value to Owners’ Cash Profits (OCP)
16 March 2018 Update:
EV to Owners’ Cash Profits is yet another metric that I believe is more accurate than price to earnings.
Shell has a payout ratio of 144.6% which means that the dividend might be unsustainable.
However, Royal Dutch Shell’s payout ratio has been below 100% from 2008 up through 2014 and I think that the payout ratio will drop to a sustainable level in the next year or two.
The return on equity for shell has also been lower than I’d like but they are also in stronger financial shape (based on the current ratio and quick ratio) than ROE king Exxon.
Another Valuation Metric for Royal Dutch Shell
One way to calculate a margin of safety is by determining what multiple of the EBIT the stock is trading at. I could write an entire article on how this is calculated (shout out to Jason Rivera who I learned this technique from).
Using the number 14 in the equation might seem somewhat arbitrary but it isn’t. The reason I chose that is because if you plug in 13.5 you get the current share price of Shell. In other words Shell is trading at EBIT x 13.5 + Cash Equivalents.
Using this metric (using a multiple of 14) we find a “fair” share price of each of these four stocks would be as follows:
RDSb – $65.9
XOM – $64.1
TOT – $75.8
CVX – $72.7
And if we compare the actual share price to these values we get the following “margin of safety” for each stock:
Using this technique we can see that Royal Dutch Shell is trading at about a 3.5% discount to 14xEBIT + Cash. Exxon is trading at a 16.27% premium, Total is trading at a generous 23.91% discount and Chevron is overvalued by a large 60.12%.
Royal Dutch Shell Class A or Class B Shares?
I used to own RDSa in a Roth IRA. The RDSa shares are subject to a 15% withholding to the Dutch government. Because of this RDSa trades at a discount to RDSb, which does not have this withholding.
At one point you could get around the 15% withholding through Shell’s scrip program (which they have discontinued twice) and get a lower price and higher yield. So it made sense to own RDSa.
But given that the scrip program has been discontinued I choose to own RDSb. I prefer to own it on the London Stock Exchange and I also own it in US markets in a Roth IRA.
Royal Dutch Shell is an Excellent Value
Shell is a great value, a cash flow machine, and pays with a strong dividend. Total is an excellent value as well although it has thin operating margins and has struggled to generate free cash flow with the same consistency as Shell and so for those reasons I prefer Royal Dutch Shell.
This website uses cookies to improve your experience. We'll assume you're ok with this, but you can opt-out if you wish.AcceptRejectRead More
Cookie Policy
Privacy Overview
This website uses cookies to improve your experience while you navigate through the website. Out of these, the cookies that are categorized as necessary are stored on your browser as they are essential for the working of basic functionalities of the website. We also use third-party cookies that help us analyze and understand how you use this website. These cookies will be stored in your browser only with your consent. You also have the option to opt-out of these cookies. But opting out of some of these cookies may affect your browsing experience.
Necessary cookies are absolutely essential for the website to function properly. This category only includes cookies that ensures basic functionalities and security features of the website. These cookies do not store any personal information.
Any cookies that may not be particularly necessary for the website to function and is used specifically to collect user personal data via analytics, ads, other embedded contents are termed as non-necessary cookies. It is mandatory to procure user consent prior to running these cookies on your website.