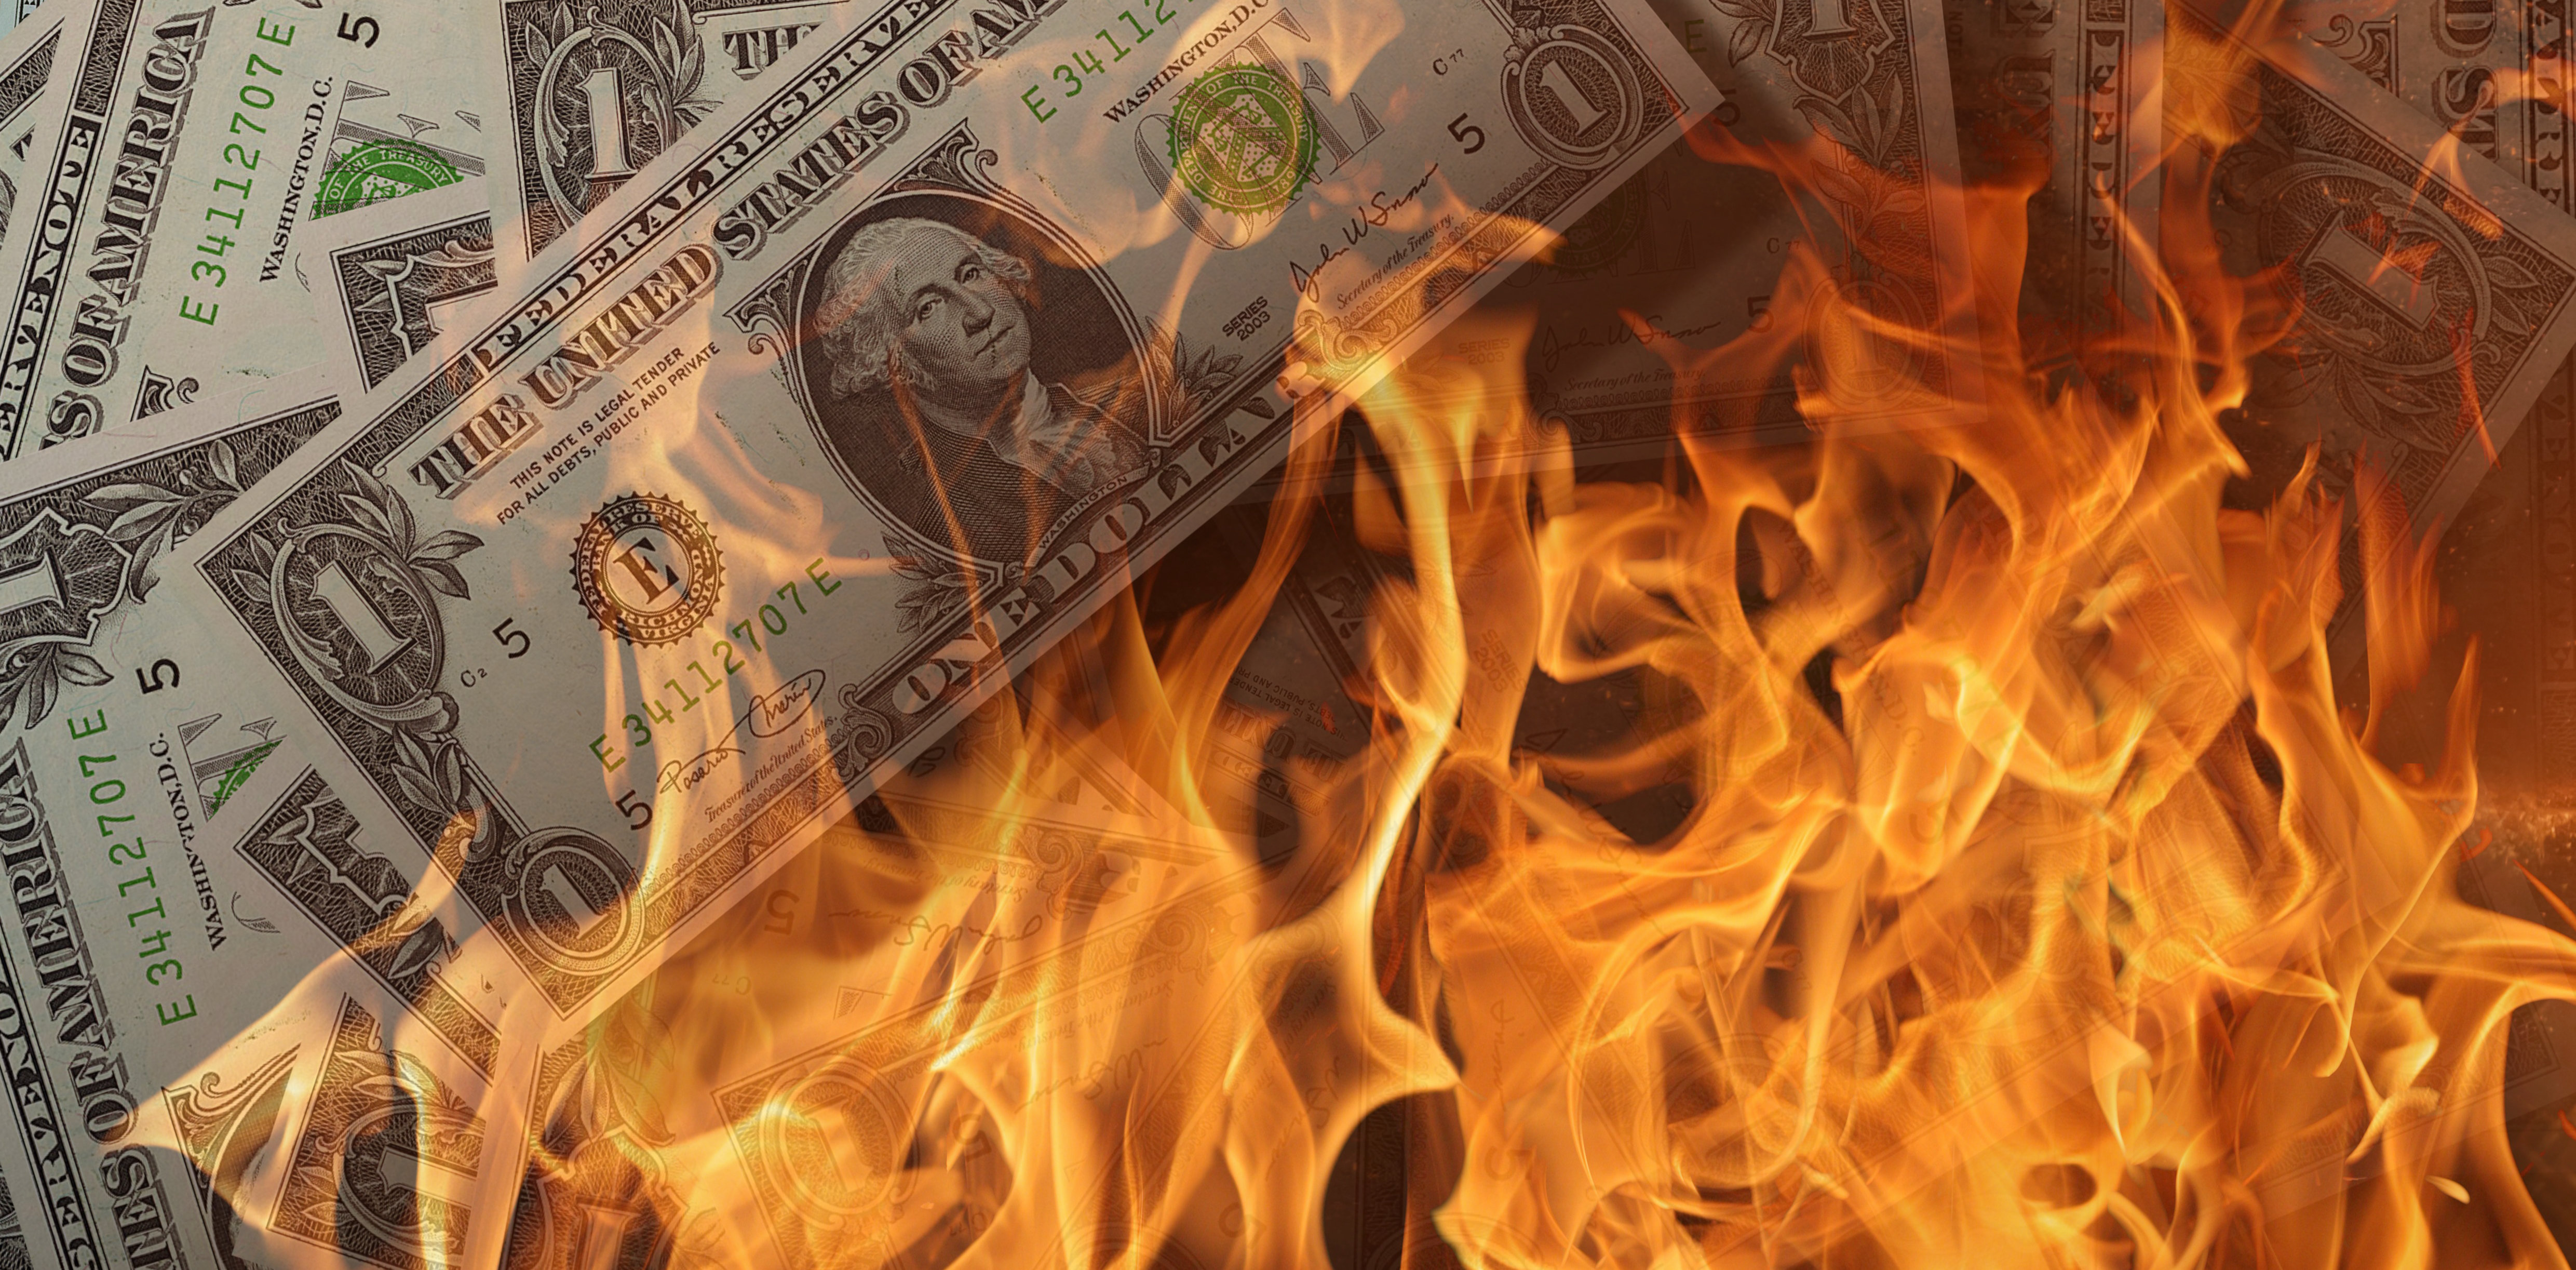
My first article on this website was over 5 years ago, Inflation Destroys Dollars. I certainly did not have any idea that the price inflation would be triggered by the government’s response to the COVID-19 pandemic. I certainly didn’t anticipate the lockdowns and supply chain disruptions back in 2016.
I know the fiscal and monetary policy pursued by the United States and virtually all the world: money printing, onerous regulations, taxes and spending, would eventually result in significant price inflation. Government response to COVID-19 has made the situation worse and pulled the day of reckoning forward but it certainly isn’t the largest factor.
Timing is always a challenge and I was quite early.
Price inflation is here and it is happening fast enough where people notice it and are actually talking about it. Depending on who you trust and how you measure it, prices are rising at a rate of 6-10% per year now. I think what is interesting is that the government’s own numbers (the CPI-U) shows inflation at 6%. This is far beyond the 2% the Federal Reserve has been calling for.
In Inflation Destroys Dollars I write about how gold and silver are an inflation hedge. On 16 May 2016 when I wrote that article, gold was trading at $1,252 per ounce. As I write this it is currently up to $1,864.61, an increase of 48.9%. That is an annualized return of roughly 7.5%.
On 16 May 2016 Silver was trading at $17.14. It is now trading at $25.29. That is a 47.5% increase for an annualized return of approximately 7.3%.
So, if you think that inflation has been somewhere between 4% and 8% over the past five and a half year, gold and silver have on just kept up with inflation during this timeframe. Not bad but also not great. Gold and silver remain the boring reliable hedge and that is a good thing.
Value Stocks as an Inflation Hedge
Value stocks are another asset class I mentioned in Inflation Destroys Dollars. I didn’t mention specific funds. I have made some of my own individual value stock picks with some fantastic picks, but also some not so good picks.
Vanguard’s Selected Value fund (VASVX) is a mid-cap fund that could serve as a proxy for “value stocks”. It was trading at $26.41 on 16 May 2016. It is currently at $33.39. This is a return of 26.4% and an annualized return of 4.3%. Not stellar as I would not say this has kept up with inflation.
The Vanguard Value Index is a large cap value fund (VVIAX). It started this period at $32.49 and is up to $56.68. This is a return of about 74.5% and an annualized return of 10.65%.
A final example to look at, Vanguard’s Mid-Cap Index Admiral Shares Fund (VIMAX) started in this timeframe at $150.33 and is now at $320.62. That is a total percent return of 113% and an annualized return of 14.7%. Much better.
Compare those to the Vanguard 500 (VFIAX), which started this timeframe at $184.53 and is now at $432.9. The total return of this fund was 134.6% an an annualized return of 16.77%.
So while value stock fund did beat the rate of inflation and are a good hedge, they didn’t outperform your vanilla S&P 500 index fund.
Bitcoin as an Inflation Hedge
Compared to gold and silver, Cryptocurrencies, particularly Bitcoin has had all the action.
On 16 May of 2016 a Bitcoin was trading at about $454. Today Bitcoin is trading at $64,346. That is an astounding increase of 14,073% or an annualized return of about 146%.
Clearly Bitcoin has outperformed Stocks, Gold and Silver during this timeframe in an astounding way.
I own Bitcoin and I’m not anti-bitcoin. But I’m also not a Bitcoin maximalist. I think it is possible and perhaps even likely that Bitcoin will be replaced with a superior cryptocurrency that has some combination of faster transactions, higher transaction throughput, anonymity and or additional features. In my view Bitcoin in its current state is too slow and transactions are too costly for it to work as a medium of exchange for day to day transactions. These views are very unpopular with Bitcoin maximalists that ignore or downplay Bitcoin’s weaknesses.
However, Bitcoin has provided an incredible return and far outpaces inflation.
The 14,073% return is not just a result of inflation, although it is increasingly being viewed as a safe haven alternative investment.
Bitcoin has had several great tailwinds 1) It is an emergent asset class 2) It is trendy and popular and gets media attention 3) It is viewed as a Federal Reserve / dollar debasement hedge in place of gold.
Inflation Hedges
Protecting one’s wealth and purchasing power from inflation is important. Just keeping up with inflation is not ideal either, if the assets are not tax advantages, the government will tax the “gains”, and so purchasing power is eroded.
Let’s look at a simplified example. Say you frequently buy a widget or pay a service that costs $100 per year. Say the price goes up 5% per year due to monetary inflation. You also have a $100 investment that also goes up 5% per year. You’re still not keeping up with inflation because of taxes. If your $100 investment goes up 5% to $105, the government is going to want some taxes on that $5 gain. Say you’re on the hook for 15% capital gains taxes, the government is going to take their share and leave you with a $4.25 gain.
So you now have to come up with another $0.75 to pay for the item or service. Scale this up to include all of your expenses for the year and you see that you need to not only keep up with inflation, but exceed inflation so you have the money to pay the taxes on the gains.
In order to keep up with inflation your investment would need to be in a tax advantaged account that would lower or eliminate the tax burden owed or (again assuming a 15% gains tax) you’d need the investment to go up by about 5.9%.
This also shows how insidious inflation is. Not only is money worth less, but the government taxes the gains, even if there was no gain in terms of purchasing power.
One other thing to keep in mind, in the United States at least, realized gold and silver gains are taxed at the generally higher income tax rate rather than capital gains tax rate.
Are Gold and Silver Great Inflation Hedges Anymore
Gold and silver might not be very good inflation hedges anymore. If I owned gold or silver I wouldn’t sell unless I needed to rebalance my portfolio. I would expect these assets to at least keep pace with inflation, but unless the demand for gold and silver increases in excess of new supply, I don’t think gold and silver will beat inflation in the way needed in order to truly hedge for inflation when accounting for taxes. While it has produced a positive return in excess of inflation, it certainly hasn’t been a fantastic play over the last five and half years since I started HowIGrowMyWealth.com.
I previously wrote an article, “I Own Too Much Gold” and I’ve gotten several replies on twitter such as, “Impossible” and “No Such Thing”.
I strongly suspect (although I can’t prove it) these folks didn’t read the article. But in case they did and still aren’t convinced here are five reasons why you don’t want to own too much gold as a percentage of your asset allocation:
Reason 1: Lack of Tax Benefits
In the US, gains on physical gold are taxed as ordinary income, which could be a lot higher for you than the capital gains rate.
Even if you were an uber-gold bull and thought it was going to $100,000 per ounce would you really want to pay all your taxes on those gains as ordinary income?
Why not invest in some gold mining stocks (which would certainly go up as well if gold skyrocketed) and pay the capital gains tax rate? Why not hold some of those gold mining stocks in a Roth IRA so you pay zero capital gains taxes?
Reason 2: Diversification
Sometimes less is more
It’s important to be diversified in non-correlated assets. If I owned no gold, it would be important to own some, as gold tends to be less correlated with stocks and bonds. However, for the same reasons why you don’t want to be all in one asset class, you don’t want have too much of your assets tied up in gold.
If all you own is gold you don’t own any silver! Some speculate that silver will go up in value even higher than gold. If that’s the case you’ll want to diversity your precious metal holdings into the gray metal as well.
Reason 3: Liquidity
If you’re like most people, you need to buy food, clothing, energy, and the staples of living. You want to have some money in a more liquid format so you can pay for these things. If all your money was in gold, how are you going to pay your taxes or buy food?
Reason 4: No Cash Flow
If you invest in a business or a rental property or a dividend paying stock, there is cash-flow. If you own shares of a company, that company has employees trying to grow the business and increase shareholder value. Gold doesn’t do anything of those things. This is okay, gold doesn’t need to do those things (which come with their own set of risks), but if all your money is in gold then you are by definition missing out on opportunities to invest in cash-flow producing assets.
Reason 5: Charity
Wealth is a good servant but a terrible master. Ultimately you can’t take your gold with you and one of the great perks of having extra money (or wealth) is giving it away to those in need!
Do you want to gift your gold to a charity and have them have to deal with selling it?
If you keep some money in local currency it is easier to donate to a good cause. My favorite charitable organization is Children of Hope and Faith they help feed, clothe and educate orphans in Tanzania. I know the founder and board members personally and I know they have very low overhead which means it is efficient and there is more money going to the kids who need it. You can’t get any better than that!
The US government can’t default because it can just print the money. I was skimming through a Bloomberg article when I found reference to this old conventional foolishness.
“It’s true that American companies aren’t the biggest borrowers in the low-rates era that began in 2008. That would be the federal government. But the government controls the dollar printing press, so it can’t really go bust. Plus, there hasn’t been a sovereign debt default in a rich country for decades.” – Bloomberg article
If the dollar printing press was so powerful, why not print $20 million dollars for each person in the US, or the world even? Why not $20 billion or $99 trillion or umpteen gazillion?
That would end poverty in the US and the world and make everyone rich!
Most people intuitively understand that this wouldn’t work.
“That’s different,” they might retort.
True. The government monetizing $20+ trillion in debt or more is different than printing millions of trillions and giving it to the people.
But the only difference between the government bailing itself out with the printing press (as it has been doing) versus making everyone a trillionaire is a difference of degree, not kind.
It is a reductio ad absurdum argument that shows, in an extreme case most people will agree with, how simply printing money won’t make everyone rich.
It doesn’t magically work any differently just because the government prints money to pay off the debt.
Counterfeiting is illegal because the Government will not suffer competition.
It’s also a reason why Universal Basic Income doesn’t work, simply creating more money will only cause prices to rise to a new equilibrium level, or shortages will occur.
A Printing Press Does Not Reduce Scarcity
There is inherent scarcity in the world. There is only so much food, energy, raw materials available on earth at any given moment in time.
Through technology and capital investment goods and services can be provided more efficiently and in greater quantity for a given amount of effort, but this only lessens scarcity, it doesn’t eliminate it.
In a more concrete example, there were only 36 1962 Ferrari 250 GTOs built. It doesn’t matter if everyone on the planet has $20 billion, $30 trillion or umpteen gazillion dollars, not everyone is going to be able to have one of these 36 Ferrari’s.
1962 Ferrari 250 GTO, one recently sold for $48.4 million
If the Fed printed up $1 trillion for everyone, and the demand for 1962 Ferrari 250 GTOs remained the same, the price of these Italian sports cars would adjust upwards over $1 trillion and the cars would still be as unaffordable for most people as they were before they became “rich.”
A printing press (or the digital equivalent) which allows the United States Federal Reserve to increase the balances of banks. It can’t create more food, energy, 1962 Ferrari’s, phones, or any additional goods or services of any kind.
Only True in a very Technical Sense
If the US government wanted to pay off the debt, they could do so with a few computer keystrokes. This is what people mean when they say the US government can’t really default.
It is true in a limited, technical sense.
But it fails to take into account what would happen if they did so. Namely that the dollar would lose a great deal of it’s value and everything would become more expensive.
This already happens and with the principles of supply and demand explains why rent, food, gasoline, and many other goods and services become more expensive each year.
If you own a government bond and the government can’t pay it all back via taxes consider two hypothetical scenarios:
Government defaults, and only pays back say half of what they borrowed, purchasing power of the dollar is preserved
Government de facto defaults, pays back all the debt with printed money, reducing the purchasing power of the dollars by half
In scenario 2 the government hasn’t technically defaulted, they paid back what was owed, but it has de facto defaulted as the lender is just as bad off as if the government had defaulted.
In both scenarios the lender only has half the purchasing power. Ultimately purchasing power is what matters when it comes to money.
“I’m out of it for a little while, everybody gets delusions of grandeur.” – Han Solo
So the next time you read or hear someone say that the US government can just pay back the debt by printing the money, remind them of the dramatic price inflation that would be unleashed upon everything priced in dollars.
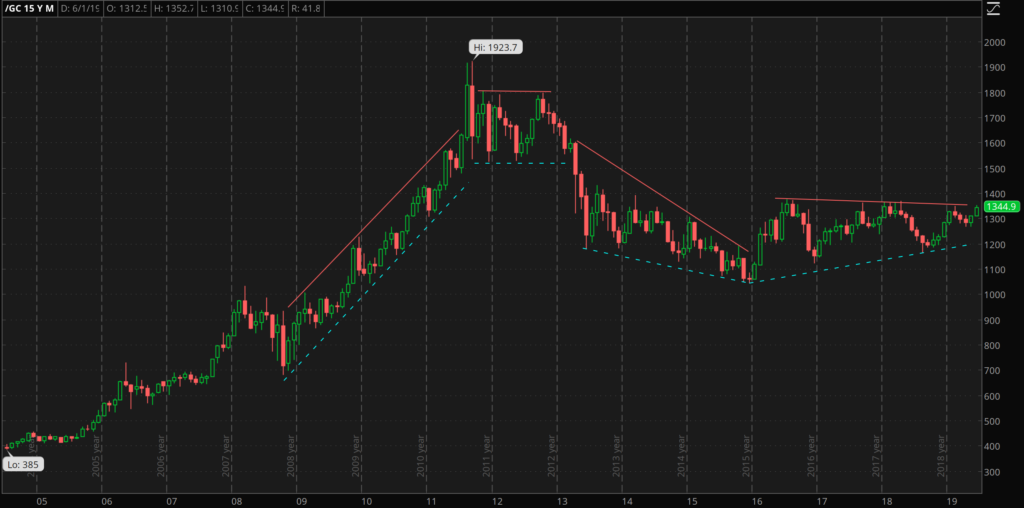
Gold is a bellwether for the health and safety of the financial system. When gold is rising in price, it indicates investor’s lack of confidence in fiat currency and the stocks, bonds and other securities priced in said fiat currency.
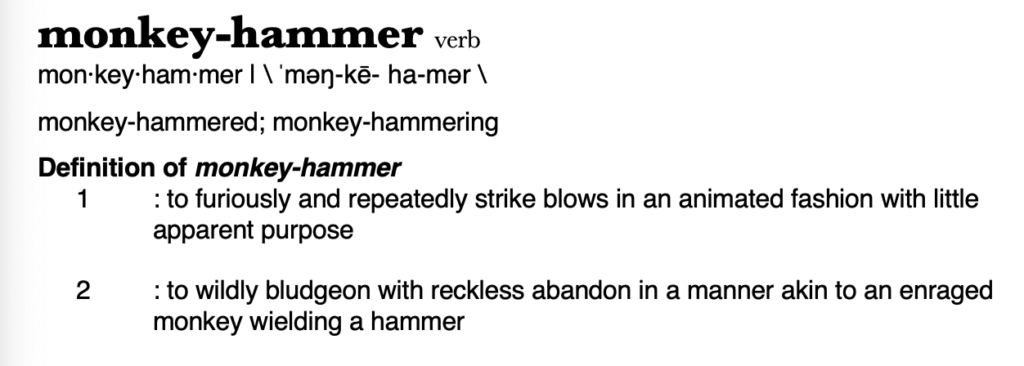
Gold Price Monkey-Hammering
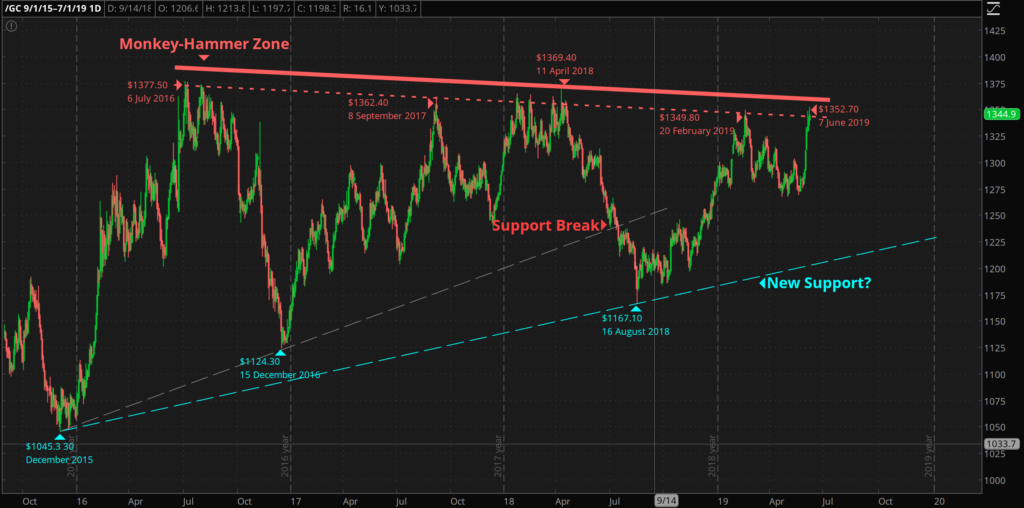
Over the past five years whenever gold trades up to the $1,350-$1,380 range it gets monkey-hammered back down.
Today the price of gold reentered the monkey-hammer zone. I would be pleasantly surprised if gold could breech $1,360 and remain there or higher but if not I think it’s likely to drop down to the $1,230-$1,240 range.
The gold-bug optimist would argue the 8 day winning streak gold has, combined with the prospect of future rate cuts and tariff uncertainty are bullish for gold.
However, if the past 8 years are any indication, rate cuts plus a lack of measured price inflation means buy stocks.
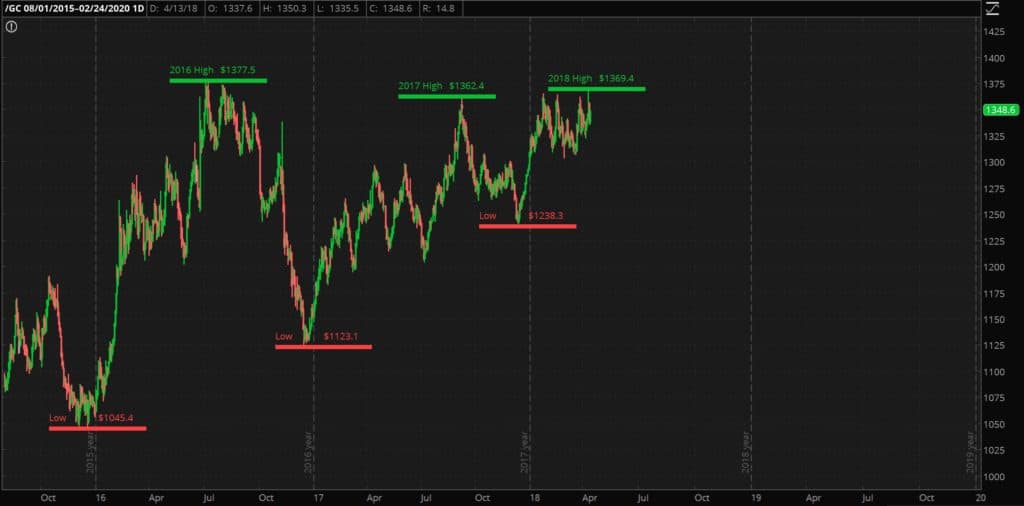
We can see from the chart above that over the past three years there are not a lot of sellers relative to buyers at the $1,050-$1,200 range and that range is trending higher. There still aren’t a lot of buyers when gold gets up to around $1,350-$1,360 and the price drops as a result.
So while the resistance level is falling somewhat, the support level is rising.
I account for the support level rising thusly: gold has performed so poorly relative to stocks for the past 8 years that anyone who was going to sell gold has already sold it and the majority of those that remain are not going to sell.
Furthermore, anyone buying physical gold at this point is planning on holding it for the long term. However, not many investors are adding to their gold holdings, since gold has performed so poorly. The result is gold is fairly rangebound even while the lower bound is rising.
In other words, most all of the weak buyers have been shaken out and only ardent gold bugs remain. The price rises and drops between 1375 and and lows are speculators, short term trend followers and weaker hands.
The Gold Market in 2019 and Beyond
I don’t know, particularly in the short to medium term if gold is going to go up down or sideways. The July 2018 selloff definitely did a fair bit of technical damage and broke down the ascending triangle pattern I had previously written about.
I’m still operating with the belief that gold bottomed in late 2015 and we won’t see $1,045 again. I don’t know what it would take for gold to break out above $1,400 or when that will happen.
If past price action is any indication of future price behavior gold will likely continue to slog along as it has since the December 2015 low until some external catalyst allows it to traverse the monkey-hammer zone and get to $1,400. In the meantime the fiat-bugs continue to win.
According to the United States Bureau of Labor statistics the rate of consumer price increases, as measured by the Consumer Price Index (CPI) is 2.4%. That is the combination of a variety of factors such as food, fuel, clothing et al. One of the factors is “Shelter” and the rate of price increases for shelter according to the BLS comes in at 3.3% for the 12 month period ending in march 2018.
It sounds comical for me to write it out but I am passionate about inflation. Inflation is a terrible injustice to the people, destructive to the economy and a leading contributor to many economic crises such as the “dot-com” bubble in 2000 and the 2008 financial crisis.
When I talk about inflation I typically mean an increase in the money supply which in many cases leads to price inflation which is an increase in prices as a result of an increase in the money supply.
I have long believed that the BLS CPI is flawed and that the actual rate of price increases is much higher, between 5-10%. And in fact if the BLS measured price inflation in the same way they did in 1990, the CPI would be 6%.
I recently renewed my apartment lease. My apartment hasn’t changed at all. And after the previous 10 month lease has ended my renewal lease rate is 2.6% higher for a new 12 months lease.
That doesn’t seem like much, and in the grand scheme of things it isn’t, but rent is the largest expense I have so it is an unpleasant increase.
I have to admit I’m not as passionate about the rent being too high as compared to say Mr. James McMillan III, who ran for Governor of New York numerous times, with high rent being a core pillar of his political platform.
Parental warning: Video below contains the “D” word
Healthcare Price Increase
According to the BLS healthcare costs rose 2% for the 12 month period ending March 2018.
I am fortunate (and grateful) to have health insurance coverage through my employer and I would prefer to be in a scenario where health insurance wasn’t tied to employment. I would prefer a true free market system in health care and health insurance. But recently I have been trying, to quote the serenity prayer, to take “as Jesus did, This sinful world as it is, Not as I would have it.”
My health insurance monthly premium actual fell by 0.66%. However, the devil is in the details.
Prior Plan
My previous plan had a $3,000 deductible, 10% coinsurance once the deductible was met and a max out of pocket (or “MOOP”) of $5,000. So if I had the worst year ever I wouldn’t pay more than about $5,000. Since I’m single, relatively young and relatively healthy I think this is a pretty good deal since my monthly premiums are very low.
New Plan
However, this plan was “discontinued” and the new “comparable” plan now has a $3,500 deductible, 20% coinsurance once the deductible is met a $5,950 MOOP.
So this means that while my premiums fell by just 0.66%, my deductible went up by 14.29%, my maximum out of pocket went up 15.97%, and the amount my insurer pays once I reach my higher deductible falls from 90% down to 80%.
I hope I don’t have to use my medical plan at all, and if I don’t I will have saved token amount of money (which I will take!), but if I do have the worst year ever (medically) then I’ll be paying nearly $1,000 more.
Why the Increase?
I’m just one person so it isn’t fair to generalize my experience to the United States as a whole, with this caveat in mind I suspect that the individual mandate being removed has something to do with it.
If people don’t have to buy health insurance anymore then that means there are fewer younger, healthy people buying insurance and on a percentage basis, more sick people with insurance. I’m sure there are a variety of factors as well but this could be part of it.
Of course I think that removing the individual mandate was a good thing–I don’t see how a “free society” can require individuals to buy something.
However, in order for Obamacare to work your really need that mandate. Obamacare made it so that people with pre-existing conditions could still get “health insurance”.
I list “health insurance” in quotes because at this point health insurance in the US is no longer insurance. Insurance is a way of protecting against a potential risk. For example you can’t buy fire insurance when your house is on fire because once it is on fire it is no longer a risk it is a certainty.
But Obamacare made it so that people can essentially buy health insurance after they get sick (they might have to wait until annual enrollment but still).
I want everyone to have access to medical care. Co-opting and ruining the health insurance industry is not a good approach to working towards a world where everyone has access to medical care.
With the individual mandate revoked but the inability for insurance providers to take into account pre-existing conditions means that prices will have to rise. A lot. This is the tradeoff, if you want to force insurance companies to “insure” sick people then the government would need to force people healthy people to buy insurance.
Of course I don’t believe in initiating force to get anyone to do anything. I am saying that in order for this coercive system to work in which insurance companies are forced to “insure” people with pre-existing conditions that you have to coerce healthy people to buy insurance.
What I’m Doing About It
In the short term nothing. I hope to remain relatively healthy and hope I don’t have to foot a $5,000 medical bill any time soon. However, in the medium to long term I have a plan that will help me pay for medical care and fight against health insurance price increases. I’ll write more about this strategy in an upcoming article.
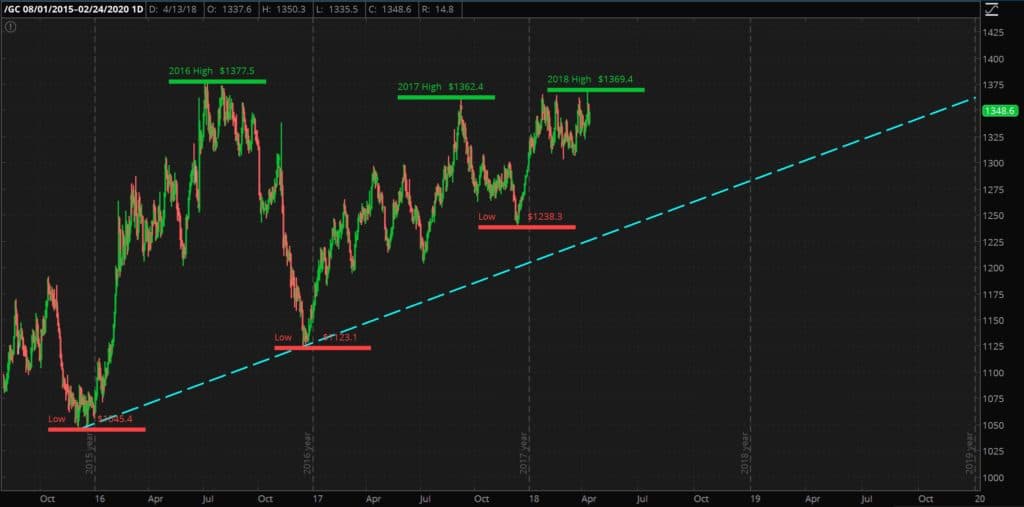
Gold has been steadily rising in an ascending triangle trading pattern since December of 2015. It’s my belief that gold bottomed in December of 2015 at $1045.4 per ounce. I don’t believe that gold will ever trade below $1045.4 again.
The highs being around the same level and then falling combined with progressively higher lows is what leads me to describe the last three years of gold price moments as an ascending triangle.
The high since gold bottomed in 2015 is $1,377.5 which occurred on 6 July of 2016. In the time between then and now gold has failed to match this high or make a new one. The price of gold has come within $20 on five separate trading days–three of which were in 2018 and one of those breakout attempts was last week.
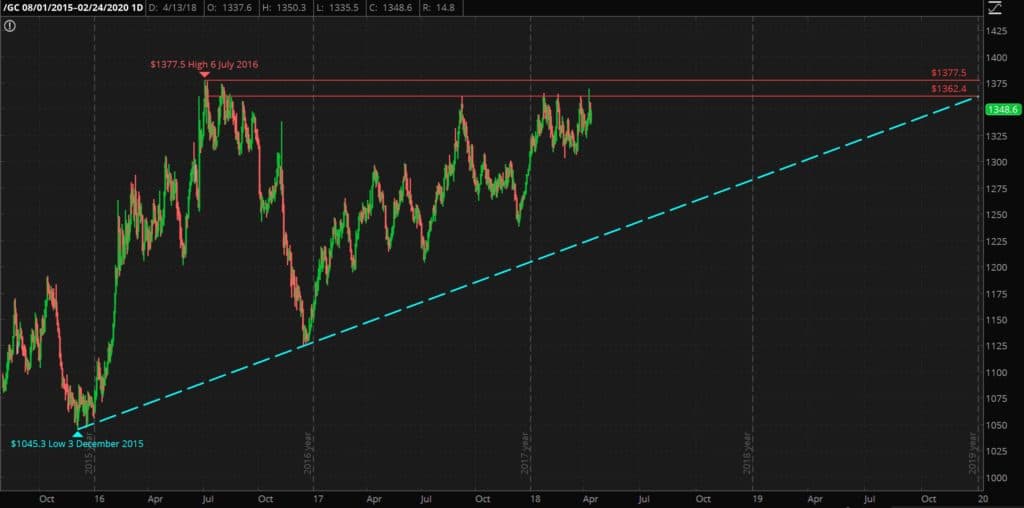
Gold has been trending upwards in an ascending triangle. The blue dashed line is what I’m calling the December 2015-December 2016 support trendline
Fundamentals for What to Buy and Charting for When
Charting is more of an art than a science and I don’t think it works well in isolation. The fundamentals of an investment need to be in place to determine what to invest in and charting may provide some insight into when an investment will move in a given direction.
Now commodities don’t have balance sheets or cashflow so the fundamentals are based on supply and demand.
The supply of gold, while growing, is fairly static, I anticipate the demand to increase substantially given my view that stocks and bonds are in a bubble and that the US Federal Reserve will step in with low interest rates and QE to reflate the bubble, as they did after both the 2000 “dot-com” crash and the 2008-2009 crisis which will eventually destroy the dollar.
It is also important to note that while the above ground supply of gold is growing, the supply of gold in the west is declining at least relative to China and India. The supply of gold might even be declining in the west on an absolute basis although I don’t know that for sure.
Even without a dollar crisis I think gold will still trend upwards over the years and it could go up several hundred dollars even without a dollar crisis simply based on technicals and trading.
Timing, however, is very challenging and it’s not a skill in which I am particularly adroit.
So I buy and hold and dollar cost average. For example if gold bounced off the lower leg of the triangle and I was under-allocated in gold I would consider buying more. At this time I already own too much gold so I haven’t been adding significantly to my holdings.
Despite gold continuing in the ascending triangle there have been some interesting price phenomena of late that merit comment.
Intraday Gold High of $1369 on 11 April
Gold hasn’t reached $1369 since August of 2016. Admittedly gold was not able hold that level last week and closed at $1356. This is still a large spike upwards. Because the fundamentals of gold are so strong I think that one of these days gold will make a new multi-year high and perhaps even hold it if it can confirm the breakout with a $50-100 move above $1377. At that point $1377 would very likely flip and represent a support level.
The $1362-$1377 has been the range of resistance for the past 2.5 years but I don’t think it will hold forever.
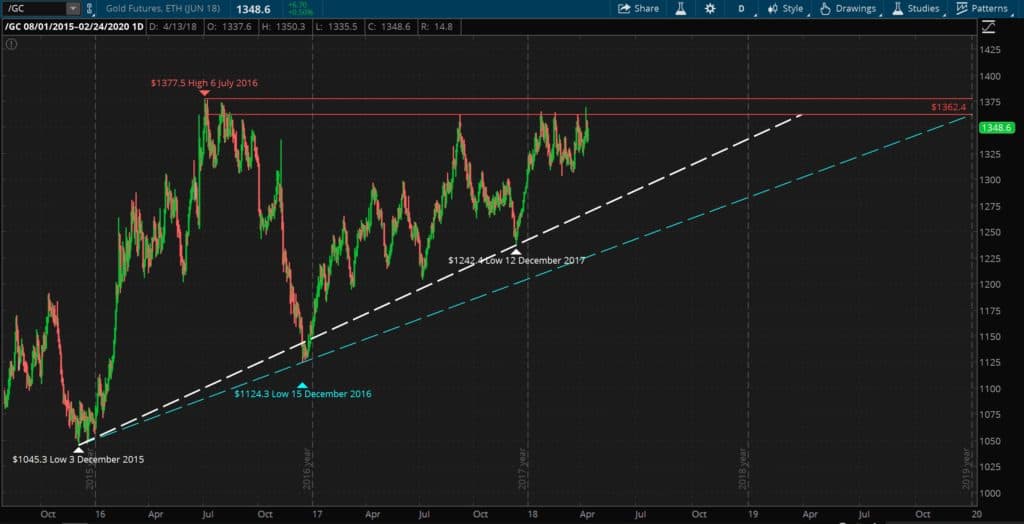
Lows are not reaching the Longer Term Trendline
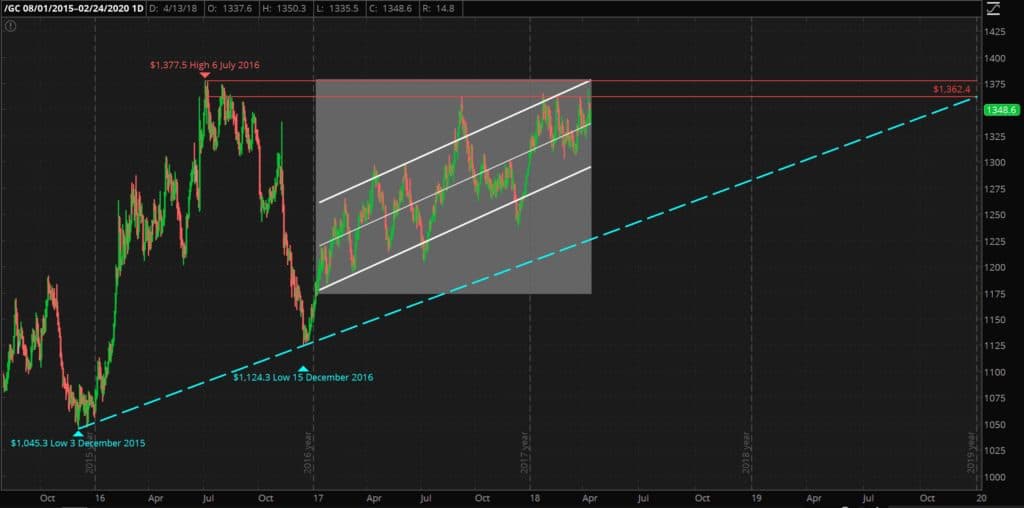
The lows have not fully dropped down to the trendline drawn from the 3 December 2015 low of $1045 to the next highest low (after a high) which was made on $1124 on 15 December 2016.
The lowest gold traded at between the 2017 and 2018 highs was $1238, and it did not reach the December 2015-December 2016 dashed blue support trendline
So while gold hasn’t been able to make it back to the 2016 muti-year high (although it has gotten within $20 five times) the lows keep getting higher.
One interpretation is that gold isn’t actually in an ascending triangle and that the December 2015-December 2016 trendline isn’t useful.
Another way to look at this price action is that gold is in an ascending triangle and the fact that the lows are getting shallower is a bullish trend.
A third is that this rally off of the 15 December 2016 low has been slower and less strong and gold will go down to hit the trendline, and may even break through, which would admittedly be bearish. It’s true that the move up nearly 32% from $1045 to $1377 only took about 6 months. It took almost 8 months to go up 21% from $1124 up to $1362.
This is where charting becomes more of an art than a science.
Compression of Gold’s Trading Range
The trading range of gold is compressed, even more-so than I would expect for an ascending triangle. Again, the highs haven’t been quite as high, but the lows are much higher as well. With a few outliers gold has been trading in a fairly narrow, upward range since the start of 2017.
With just a few outliers gold has traded in a fairly narrow range since the beginning of 2017
As I’ve said above the lows have not fully retraced the December 2015-December 2016 trendline. Yet another interpretation of this is that gold is in a very weak and slow rally. That the highs in 2017 and 2018 don’t count because they didn’t make it fully to $1377 and we’ll retrace the December 2015-December 2016 support trendline.
However I don’t think this is the case when you factor in market sentiment.
Gold Climbing a Wall of Worry
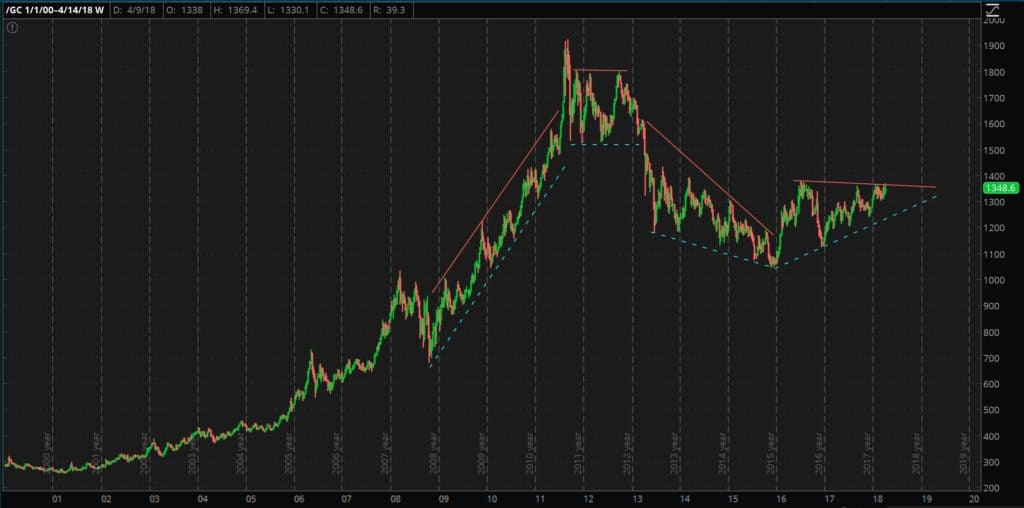
While gold has been trending up since the turn of the century, it had been a losing investment for many years in the wake of the all time highs that were made in September of 2011 in the wake of the 2008-2009 financial crisis. Gold was in a bear market for 3 years in a row from 2013 to 2015. Except for a few months, anyone who bought in 2011 or 2012 and held through to today is still underwater.
Gold has been a winner since the turn of the century
The narrative touted by Barrack Obama and now Donald Trump has been that everything is great and everything is improving. Sitting presidents always talk up the economy while they are in office because they want to get re-elected or if in their second term ensure they have a positive legacy.
Obama and Trump (at least until February 2018) have simply been after to refer to a chart of the S&P 500 as proof the economy is doing great.
So, most investors think they have no reason to own gold, since everything is great, and they don’t want to miss out on the stock market, which has been going up quite a bit until recently.
At the same time, 3 years of a gold bear market has shaken out the weak hands. There aren’t very many people who still own gold at this point who are going to sell now. If they held onto their gold as it fell from $1900 down to $1045 I don’t see why they would sell at $1150, $1250, or $1350.
So while there aren’t enough buyers stepping in to bid gold up over the 2016 high there also aren’t enough sellers for gold to drop significantly. That explains why gold can’t make new highs and why the lows continue to rise.
That is how I interpret the gold price chart.
If I’m right this also means is that when sentiment does change, when more people realize that stocks aren’t going to keep going up and that the economy isn’t great, they will move towards gold, but there won’t be many sellers, at least not at these prices. I could easily see gold going up $300 to $1600-1700 just from a technical perspective.
I do think Gold trading up to the $2000-$3000 would require a full on dollar crisis.
I don’t know when such a dollar crisis will take place. In my opinion given the debt, the lack of manufacturing, and the increase the growth the debt combined with rising interest rates that will increase the amount the US has to pay in interest on the debt are all fantastic reasons for a currency crisis to have already occurred.
Gold Market Ascending Triangle Timing
If gold is in an ascending triangle, as I believe it is, gold will break out of this pattern up or down within the next two years. Perhaps as soon as early 2019 depending on how you draw the support line. In either case I would want to see a strong move $50-100 above the $1377 resistance level to confirm trend was bullish or $50-100 below the support level as confirmation the trend was bearish.
While in the minority as gold bull I’m certainly not the only person with these views. Peter Schiff talked about the gold market trading range narrowing in a recent podcast (about 17 minutes in) and a 1 March article this year from Commodity Trading Mantra draws conclusions similar to my own.
This website uses cookies to improve your experience. We'll assume you're ok with this, but you can opt-out if you wish.AcceptRejectRead More
Cookie Policy
Privacy Overview
This website uses cookies to improve your experience while you navigate through the website. Out of these, the cookies that are categorized as necessary are stored on your browser as they are essential for the working of basic functionalities of the website. We also use third-party cookies that help us analyze and understand how you use this website. These cookies will be stored in your browser only with your consent. You also have the option to opt-out of these cookies. But opting out of some of these cookies may affect your browsing experience.
Necessary cookies are absolutely essential for the website to function properly. This category only includes cookies that ensures basic functionalities and security features of the website. These cookies do not store any personal information.
Any cookies that may not be particularly necessary for the website to function and is used specifically to collect user personal data via analytics, ads, other embedded contents are termed as non-necessary cookies. It is mandatory to procure user consent prior to running these cookies on your website.