by John | Mar 27, 2018 | Passive Income, Stocks I Like, The Stock Market, Value Investing
Normally you’d have to pay a lot of money for the type of in depth analysis I’m providing here on Royal Dutch Shell. Take a moment to sign up to my zero-cost-to-you spam-free email newsletter for future analysis on stocks, financial markets and alternative investments.
Overview of Royal Dutch Shell
Royal Dutch Shell (RDSb London Stock Exchange, RDS.B NYSE) is in my opinion a fantastic stock that is undervalued. It’s been profitable even in years in which oil prices were plummeting.
In an environment where traditionally safe investments are risk free reward Shell stock provides an attractive 5.86% yield. While I don’t provide personalized investment that is suitable for an individual’s unique situation I have determined that owning stock in Royal Dutch Shell makes a lot of sense for me.
When I value a stock there are a number of metrics I look at when evaluating a security:
1) Enterprise Value to Market Capitalization (EV/Market Cap)
2) Enterprise Value to Free Cash Flow (EV/FCF)
3) Enterprise Value to Earnings Before Interest and Tax (EV/EBIT)
4) Enterprise Value to Owners’ Cash Profits (OCP)
5) Operating Margin
6) Dividend Yield
7) Return on Equity (ROE)
Energy production is very capital intensive so I’ve compared Royal Dutch Shell (RDSb) to similar companies: Exxon Mobil (XOM), Total (TOT), and Chevron (CVX).
Data is from Morningstar.com as of 13 March 2018 (with the exception of EV/Owner’s Cash Profits) which is from yCharts.com as of 16 March 2018.
So how does RDS compare to other oil companies of a similar size?
1) EV/Market Cap
I like to see an EV/Market Cap below 1. Of these four energy companies none meets this criteria and RDSb is actually the highest. Total is the lowest just edging out Exxon Mobil by what amounts to a rounding error.
RDSb – 1.242
XOM – 1.134
TOT – 1.129
CVX – 1.154
Winner: Total (TOT)
2) Enterprise Value to Free Cash Flow (EV/FCF)
EV/FCF is where RDSb really shines compared to it’s peers. EV/FCF is in my view a more accurate measure than Price to Earnings (PE). The lower the Enterprise Value compared to Free Cash Flow means you’re paying less for an earnings stream.
RDSb – 19.55
XOM – 24.42
TOT – 28.99
CVX – 36.15
Winner: Royal Dutch Shell (RDSb)
3) Enterprise Value to Earnings Before Interest and Tax (EV/EBIT)
Another metric which I think is superior to Price to Earnings where a lower is better.
RDSb – 18.31
XOM – 18.57
TOT – 14.68
CVX – 26.98
Winner: Total (TOT)
4) Enterprise Value to Owners’ Cash Profits (OCP)
16 March 2018 Update:
EV to Owners’ Cash Profits is yet another metric that I believe is more accurate than price to earnings.
EV / Owner’s Cash Profits / EV/Owner’s Cash Profits
RDSb – 331.89 / 8.875 / 37.4
XOM – 357.85 / 9.753 / 36.69
TOT – 170.82 / 5.36 / 31.88
CVX – 254.97 / 0.758 / 336.41
Winner: Total (TOT)
Source: yCharts
5) Operating Margin %
All else equal a higher operating margin percent is better than a lower one. Exxon Mobil wins by a large margin in this category.
RDSb – 6.59%
XOM – 19.71%
TOT – 4.91%
CVX – 6.72%
Winner: Exxon Mobil (XOM)
6) Dividend Yield
Stocks in the oil and gas industry typically pay good dividends. Shell pays the highest of these four:
RDSb – 5.86%
XOM – 4.09%
TOT – 4.84%
CVX – 3.73%
Winner: Royal Dutch Shell (RDSb)
7) Return on Equity (ROE)
The ROE of Shell lags it’s peers. I typically look for an ROE over 8%.
(TTM) / (5 Year)
RDSb – 5.61% / 6.48%
XOM – 11.10% / 13.54%
TOT – 7.85% / 8.19%
CVX – 6.26% / 8.31%
Winner: Exxon Mobil (XOM)
Reasons to be Cautious
Shell has a payout ratio of 144.6% which means that the dividend might be unsustainable.
However, Royal Dutch Shell’s payout ratio has been below 100% from 2008 up through 2014 and I think that the payout ratio will drop to a sustainable level in the next year or two.
The return on equity for shell has also been lower than I’d like but they are also in stronger financial shape (based on the current ratio and quick ratio) than ROE king Exxon.
Another Valuation Metric for Royal Dutch Shell
One way to calculate a margin of safety is by determining what multiple of the EBIT the stock is trading at. I could write an entire article on how this is calculated (shout out to Jason Rivera who I learned this technique from).
Basically I’m looking at (EBIT * 14) + Cash Equivalent / Shares
Using the number 14 in the equation might seem somewhat arbitrary but it isn’t. The reason I chose that is because if you plug in 13.5 you get the current share price of Shell. In other words Shell is trading at EBIT x 13.5 + Cash Equivalents.
Using this metric (using a multiple of 14) we find a “fair” share price of each of these four stocks would be as follows:
RDSb – $65.9
XOM – $64.1
TOT – $75.8
CVX – $72.7
And if we compare the actual share price to these values we get the following “margin of safety” for each stock:
(EBIT * 14 + Cash) / (Current Share Price) / (Margin of Safety)
RDSb – $65.9 / $63.59 / -3.49%
XOM – $64.1 / $74.53 / 16.27%
TOT – $75.8 / $57.66 / -23.91%
CVX – $72.7 / $116.46 / 60.12%
Winner: Total (TOT)
Using this technique we can see that Royal Dutch Shell is trading at about a 3.5% discount to 14xEBIT + Cash. Exxon is trading at a 16.27% premium, Total is trading at a generous 23.91% discount and Chevron is overvalued by a large 60.12%.
Royal Dutch Shell Class A or Class B Shares?
I used to own RDSa in a Roth IRA. The RDSa shares are subject to a 15% withholding to the Dutch government. Because of this RDSa trades at a discount to RDSb, which does not have this withholding.
At one point you could get around the 15% withholding through Shell’s scrip program (which they have discontinued twice) and get a lower price and higher yield. So it made sense to own RDSa.
But given that the scrip program has been discontinued I choose to own RDSb. I prefer to own it on the London Stock Exchange and I also own it in US markets in a Roth IRA.
Royal Dutch Shell is an Excellent Value
Shell is a great value, a cash flow machine, and pays with a strong dividend. Total is an excellent value as well although it has thin operating margins and has struggled to generate free cash flow with the same consistency as Shell and so for those reasons I prefer Royal Dutch Shell.

by John | Jan 1, 2018 | Investor Mindset, Investor Psychology, Learning from Mistakes, Passive Income, Personal Journey
A year ago I communicated some of my goals for 2017. Today I’d like to review how I did with my goals from last year. In the coming days I’ll share some of my new goals for 2018.
Grow my Trading Account by 8%
This was the least successful of all my goals. I was not able to grow my trading account using the covered call strategy. A number of my value stocks don’t have options, so I wasn’t able to sell covered calls on them. And some of the covered calls I sold were too close to where the stock was trading and the covered call was exercised.
Stick to my Budget
I was rather frugal in 2017 and for the most part stuck to my budget. I would like to watch it more closely in 2018. My strategy is mainly to pay myself first (retirement, savings, investment contributions) and then as long as I’m able to pay for my rent and other expenses without going into debt I’m doing fine. I would like to keep a closer watch in 2018.
Make $1,000 Selling Coins
In previous years there have been some very much in-demand coins that I was able to sell for a goodly profit, however, none of these opportunities presented themselves in 2017 so I did not make any money (or lose any money) selling coins.
Grow HowIGrowMyWealth.com Audience to 500 Users per Month
I had an average of 630 users (as defined by google analytics) per month in 2017. My best month was December, with 816 users. Thank you! So I was able to exceed this goal by 26%!
Yearly totals include:
9,139 Sessions
7,101 Users
13,535 Pageviews
2017: A Mixed Year
All in all it was mixed. I exceeded my goals for increasing the audience of this website (again thank you!), however, some of my other goals fell short.
Some of those reasons were outside of my control (exchanges booting US based customers, the mint not creating rare in demand coins). However there are several things I could have done better.
More accountability and tracking
Talking about one’s goals with someone else is critical. I also think it is important to print off your goals, carry your goals with you and check on them on a regular basis. I hope to do ever better in 2018 and look forward to sharing some of my new goals in the coming days.
Happy New Year!
by John | Apr 23, 2017 | Cryptocurrency, Learning from Mistakes, Passive Income
Today I wanted to cover how to calculate cloud mining profitability. I had a recent comment on my article: Ethereum Cloud Mining is not Profitable that I’m concerned perpetuates the kind of static analysis that will cause someone to lose money on cloud mining.
I’m going to do my analysis for Ethereum Cloud Mining. However, this analysis will work for any coin that has increasing mining difficulty.
Assumptions: I’m assuming the price of ETH is static. Why? Because if it goes up, that is simply a bonus. If mining isn’t profitable unless the currency goes up, then one is better off buying the currency outright.
Step One of How to Calculate Cloud Mining Profitability
First you need to know how much the cloud mining will cost per unit of hashing power. As of 23 April 2017 Hashflare.io is selling 100 KH/s for 2.20 USD. That is 1 MH/s for 22 USD.
Use a static calculator first. This will provide the baseline static analysis. For Ethereum I like this calculator.
As of writing there is a network hashrate of 22595.62995398704 GH/s, a blocktime of 13.31 and one ETH going for 48.63 USD.
So with 1 MH/s I would earn 0.043093 ETH per month, worth 2.10 USD per month. Multiply that by 12 and the total ETH mined (0.517116) would be worth $25.2.
So if the price of ETH stays the same (which for the purpose of the static analysis we will assume it will), and the network hashing power stays the same. Then the profit will be $3.2 after a year IF THE NETWORK HASHING POWER STAYS THE SAME. The problem with a static analysis is that network hashing power does NOT stay the same.
Network Mining Difficulty Goes Up
If you stop with this static analysis you’ll surely lose money though. Why? Because the network hashing power has historically gone up and gone up A LOT.
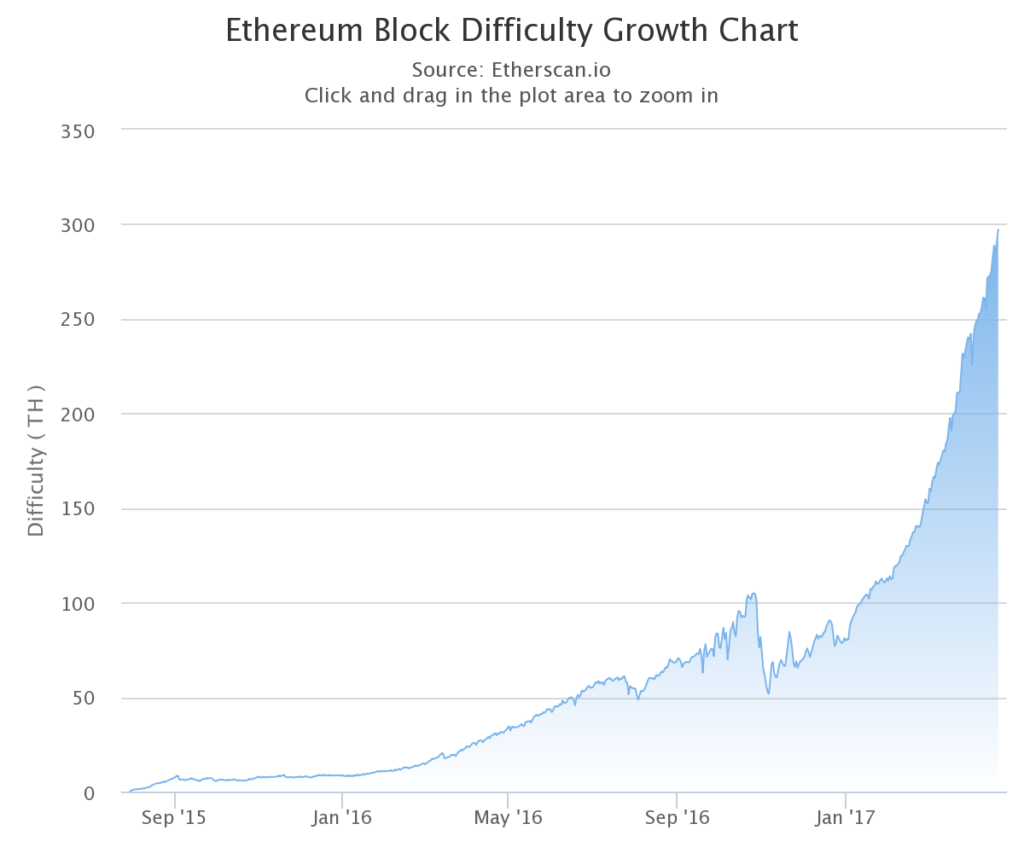
Ethereum Block Difficulty Growth Since 30 July 2015
In the first four months of 2017 alone, mining difficulty for Ethereum has gone up over 200% from under 100 TH/s up to nearly 300 TH/s. Which means the amount of ETH mined for anyone with fixed hashing power will have been reduced by over 66%.
Factoring in the growth rate of block difficulty is the most important factor when determining cloud mining profitability.
Step Two of How to Calculate Cloud Mining Profitability
Projecting how much the network hashrate will increase over the life of the cloud mining contract is vitally important. You need to make a realistic estimate of how the network hashrate will increase because it will reduce the amount you get from mining each day.
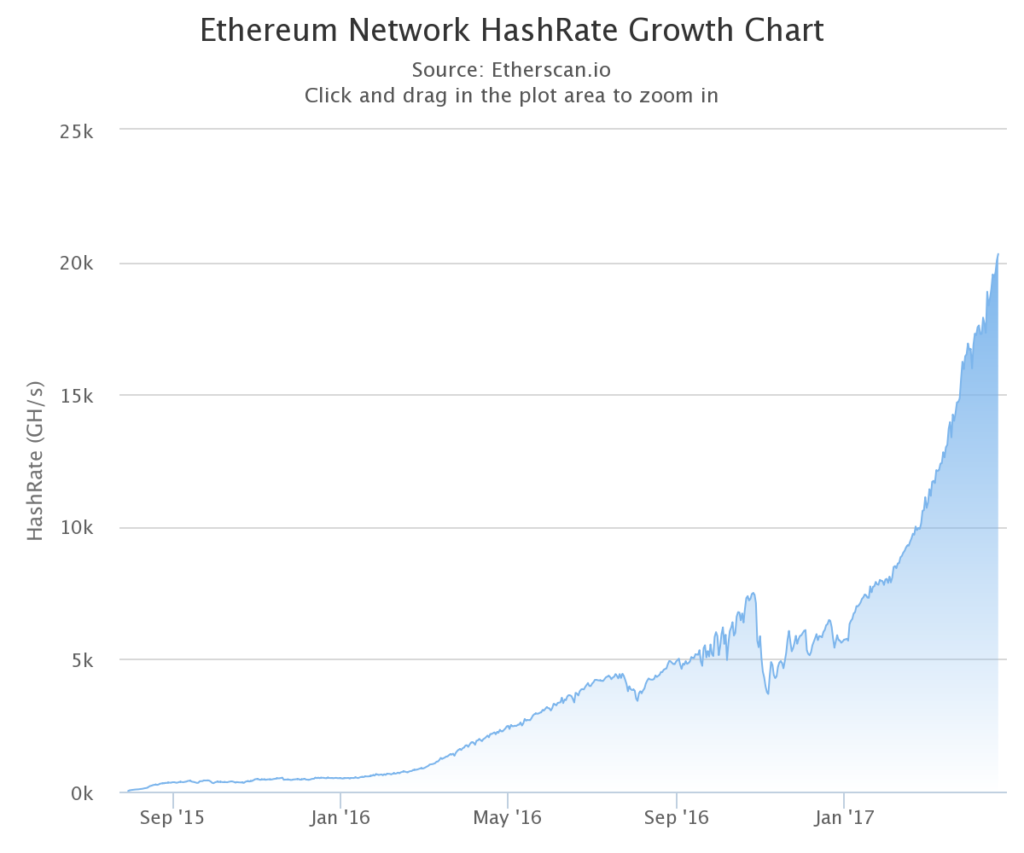
The chart above shows the Ethereum network hashrate growth. In this example, Hashflare.io contracts run in 12 month increments. So we need a realistic estimate of how much the hashing power (and thus mining difficulty) will go up over a 12 month period.
This takes some guesswork but the best indicator is the past.
The August 2015 hashrate of 55 GH/s to the August 2016 hashrate of 3,811 GH/s represents a 6,800% increase. This was the first 12 months of the Ethereum network coming online so I think this number is too high.
In 2016 the Ethereum network hashrate went from 511 GH/s to 5,700 GH/s. A 1,015% increase.
From April 2016 at 1752 GH/s to April 2017 of 20,300 GH/s was a 1,058% increase.
So I based on 2016 I think a 1,000% increase in hashing power is a good conservative guesstimate. That means the hashing power would be around 230,000 GH/s by April of 2018.
So then we follow step 1 again using the static calculator. Using the 1 MH/s and a network hashrate of 230,000 GH/s. The monthly ETH mined would be 0.004233 worth $.21.
Step Three of How to Calculate Cloud Mining Profitability
So at this point we have a projection of how much we’ll get from mining in the first month. And how much we’ll get in the last month. These are just a projections based on a static analysis and a guesstimate of where mining difficulty will be in the future.
But the amount mined doesn’t jump down from the first month to the last month. The amount mined is slowly and steadily decreasing.
I think a exponential decay model fits the data better but for the sake of ease I think a linear model will suffice.
I also think a simplified method works because the cloud mining rates I’ve seen are not close to what they would need to be for mining to be profitable.
Take the amount we think we’ll mine in the first month. In this case .043093. Then take the amount we’ll think we’ll mine in the last month, .004233. Subtract the first from the last. Then divide that by 11.
From that point you take the starting value of .043093 subtract the decay amount .003943 to get the second months value of .039149. You do this again until you get to month 12. By summing up each month’s value we get 0.283956. Multiply that by the price of ETH of 48.63 USD and we get $13.80.
The contract in this example cost 22 USD so this would not be profitable if the network hashing power goes up by 1000% (as it did in 2016) and the price of ETH stays the same.
You’d end up losing $8.2.
Okay, what if the network hashing power only goes up 500% so it goes up to 135,600 GH/s after one year? You’d mine about .3 ETH worth $14.66. You still lose.
What if the network hashing power only goes up 100% to about 45200 GH/s? You’d mine about .387 ETH worth less than $19. Loser.
What if the network hashing power only goes up 35% to 30,500 GH/s. You’d mine about .45 ETH worth $22.88. Small winner.
If Network Hashing Power Goes Up You Start to Lose
So what I hope this shows is that if the hashing power goes up, which in the case of Ethereum (and I suspect most coins as well) the amount of coins mined will drop and the profits will be eroded.
Easy Method
If you believe network hashing power will continue to go up then use this method to determine if mining is even worth a closer evaluation: use the static mining profitability calculator. Use the amount of ETH mined and the cost of the mining contract to see how much you’re effectively paying per ETH.
For example Hashflare.io is selling 1 MH/s for 22 USD for a year. That would yield 0.043093 ETH per month x 12 would be 0.517116 ETH for the year mined if the network hashrate stays the same. So the cost per ETH would be 42.54 USD. With ETH trading at 48.63 USD that is only a 14% discount over a year.
Unless you’re going to get ETH (or whichever other coin) at a significant discount using the static calculation (say 40-50% below spot price). It’s not worth it.
But the Price of ETH is going to double!
Great! Then buy ETH directly. Lets say the price of ETH does double in a year. It goes from 48.63 USD today up to $97.26. You could have bought $22 worth of ETH (.45 ETH) and the $22 worth of ETH would now be worth $43.76.
With a 1000% network hashrate increase you’d have only mined 0.283956 which would be worth $27.61. Unless the mining is profitable with the price of ETH fixed, you’re better off owning the currently directly even if the price of the currency goes up.
At what price would cloud mining be worth it?
As of today 23 April 2017, based on a 1000% increase in hashing power over the next year I would not pay more than around $7 for 1 GH/s of hashing power.
Based on my projections that would yield about 40%. Given the risk and volatility in cryptocurrencies I would need to see that kind of return for it to be worth the risk to me.
With 1 GH/s costing 22 USD, if the network hashing power stays the same I would still only make about 15%. Given the history of network hashrate increases that isn’t worth it.
Hashflare.io is nowhere close to $7 per GH/s. Genesis Mining offers 1 GH/s for 2 years for 29.99. Who knows where the network hash rate will be in 2 years.
Some People Claim Cloud Mining is Profitable
I have read testimonials from people who think cloud mining is profitable. My main question would be is it profitable because the underlying cryptocurrency went up, or because the mining itself was profitable? In other words would you have been better off just owning the cryptocurrency directly?
by John | Feb 5, 2017 | Passive Income, Value Investing
My desire for improvement has lead me to search for better metrics for value investing.
My belief in the power of value investing is unchanged but the metrics I look at have evolved.
Most people instinctively want to buy things on sale to get a great deal. But for some reason there is an exception when it comes to investing–people tend to buy stocks that are expensive.
Value investing takes the principle of finding a great deal and applies it to the stock market.
The the goal of value investing is to find profitable companies trading at a discount.
I’ve written in the past about value investing metrics and how it is one of the ways I grow and protect my wealth.
But if I can find a better and more reliable way to find a great deal I’m going to use that method.
The first reason I questioned the metrics I had been using was an article by Jason Rivera: “Why The P/E Ratio Is Useless – And How To Calculate EV” which is an excellent read.
The second was a video by Simon Black of SovereignMan.com: “How to identify the most compelling investments on the planet“.
Better Value Investing Metrics
So what metrics am I using to find great deals on stocks?
1) Enterprise Value to Market Capitalization (EV/Market Cap)
2) Enterprise Value to Free Cash Flow (EV/FCF)
3) Enterprise Value to Earnings Before Interest and Tax (EV/EBIT)
4) Enterprise Value to Owners’ Cash Profits (EV/OCP)
5) Operating Margin
6) Dividend Yield
7) Return on Equity (ROE)
If you aren’t familiar with some of these terms, no worries, just click on the word to view the definition in the glossary.
The Metrics
Enterprise Value to Market Capitalization (EV/Market Cap)
This ratio indicates if a company has more cash than debt. I look for a value of less than 1, the lower the better.
If a companies EV or TEV is less than its market cap its means that the company has more cash than debt. And may be undervalued. Inverse is true as well.
Source: https://www.quora.com/What-does-it-mean-when-enterprise-value-is-more-than-market-cap
Enterprise Value to Free Cash Flow (EV/FCF)
This is a more reliable metric than price to earnings (PE) (more on that in a subsequent article). It takes the enterprise value and divides it by free cashflow. I want this to be as low as possible.
A lower number indicates one is paying less for a stream of cash flowing into a company than compared to a higher number.
Enterprise Value to Earnings Before Interest and Tax (EV/EBIT)
Another metric that is more reliable than PE. It’s a way to double check the cost of a cashflow stream. The lower the better.
Enterprise Value to Owners’ Cash Profits
A third replacement for PE.
If EV/FCF, EV/EBIT, and EV/OCP are all low, that is several metrics that indicate the stock is trading at a discount relative to peers with a higher ratio.
Operating Margin
This is a measure of efficiently. A higher operating margin is better than a lower one.
Dividend Yield
A company can’t fake dividends. The dividend is money that goes directly to a shareholder and the yield is how much the dividend costs as a function of the share price. Investing in a stock with a dividend yield is also a way to collect income while waiting for the company’s share price to rise in value to reflect the fundamental indicators.
The higher the dividend yield the better–all else equal.
Return on Equity over 8%
This is another metric that indicates if a company is profitable. Relying on multiple metrics versus one or two provides multiple failsafes to increase the likelihood one is purchasing a valuable company at a discount.
The Stocks I Like Based on These Metrics
I list my Value Stock Picks, which are based on the value investing metrics I use.
Subscribers to the HowIGrowMyWealth Email Newsletter know that I’ve been selling a fair amount of stock as a result of these refined metrics.
Some of that is profit taking, but these metrics have also enabled me to see problems with certain stocks that I otherwise thought were a great value.
HIGMW Email Subscribers also learned of my latest value stock picks back on the 2nd of February.
by John | Jan 15, 2017 | Learning from Mistakes, Monthly Income, Passive Income
Bitfinex was hacked back on 2 August 2016. About 36% of Bitfinex holdings were stolen. All Bitfinex account holders took a 36% loss and were issued one BFX token for each dollar-equivalent in value that was lost.
BFX tokens are basically “IOUs” specific to Bitfinex. I was issued the 313 BFX tokens since I had lost 313 dollars.
BFX tokens were then made tradable and the price plummeted from a 1 to 1 parity with the dollar down to a fraction of a dollar.
This enabled folks to close their BFX tokens and get some of their money back immediately. Or they could choose to hold onto the BFX and wait for Bitfinex to raise capital to make good on these IOUs.
I was fairly upset for a while about this hack and my loss. I withdrew the remaining 64% of my holdings from Bitfinex and I didn’t login to Bitfinex for a while.
But one of my readers informed me that he was going to be investing some more money in margin funding at Bitfinex and that got me interested again.
Plus I still had 313 BFX tokens sitting in my account.
BFX Redemptions are Slow
About a month after the hack, in September 2016, Bitfinex started redeeming BFX tokens for dollars at a 1 to 1 parity. They essentially began making good on the IOUs they’d given out.
I received $17 in BFX token redemptions between 1 September 2016 and 7 January 2017. Bitfinex most recently redeemed 2% of all outstanding BFX tokens on 10 January.
I calculate that if it took four months to get $17 back it will take over six years to get the rest back.
Because the rate of redemption is so slow I sold my BFX tokens for dollars at a rate of .55 USD per token.
I’ve started margin lending using these dollars.
Why go back to Bitfinex after their security breach cost me 36%?
My thought process is that Bitfinex was hurt so much by the last hack that they are hyper-vigilant now. They’ve implemented additional security features such as two-factor authentication and offline, cold wallets.
Bitfinex is the only game in town I’m aware of that allows users to do margin funding.
And I want to recoup my losses. As of writing the “Flash Rate of Return” for margin funding is .07% per day. So based on my calculations I should be able to get back to $313 in about 3.5 years.
That is assuming the FRR stays at or above .07% per day. Hopefully it goes up.
Bitcoin is Volatile

Bitcoin Price Projection Diagram
I think margin funding is a great way to take advantage of the popularity of Bitcoin without the exposure to BTC price fluctuations.
BTC is volatile which is something that traders like.
In January Bitcoin started around $950 went up over $1,100, then back down to roughly $800.
Do These Price Fluctuations Matter?
If I believed Bitcoin was a great long term holding I don’t think I would care about these price fluctuations. A big run-up would be a time to take some money off the table and a big drop might be a time to increase my holdings.
Some people like holding BTC and believe it will go “to the moon” but I am somewhat skeptical of Bitcoin as a currency and I don’t know that BTC will be valued higher 10 or 20 years from now than it is today.
I prefer gold over Bitcoin because it has a 3,000 year history of being valued; but as I’ve said before, you can own both (I do). I just choose to own much more gold than Bitcoin.
I still like Margin Funding
By being a margin lender (in my case with USD) I’m not exposed to Bitcoin price changes and there is a set rate of return each time funds are lent out. From a market perspective there is no BTC price risk.
There is USD debasement risk. But the main risk, as I learned, is hacks.
There is also counter-party risk but I believe Bitfinex to be a reputable company.
Of course I wish they had better security so they never got hacked in the first place but I think they handled the situation fairly well and have taken a lot of steps to increase security.
It is too bad for that folks in US are not eligible to buy BFX tokens (if I recall correctly they were selling for .33 USD at one point and are now at .59, that would have been a good trade).
Citizens of the land of the free were also not eligible to partake in the BFX token-for-equity-programs–onerous US regulations are to blame for these restrictions.
I discuss the benefits of margin funding in more detail in my article Margin Funding to Generate Passive Income. I do think that it is a market-safe way to grow wealth, but the risk of future hacks is not something to be taken lightly.
If you do decide that signing up for a Bitfinex account is right for you, use this link: Bitfinex.
by John | Dec 18, 2016 | Options, Passive Income, Value Investing, Wealth Protection
I’ve decided to pivot towards a more passive option approach with covered calls.
The reason is twofold. First, I haven’t done well with options (except for August) because of mistakes I’ve made.
Back in November, after the surprise election of Donald Trump and the ensuing stock market melt-up, my option positions blew up and I lost around $1,500. My account size at the time had been around $10,000 so that is a big, big percentage loss over a short period of time.
The second reason is I don’t have free time during trading hours.
Reason One: I Made Mistakes
It should not have mattered much when the markets moved a lot. I pay to follow Kirk DuPlesis’s trades over at OptionAlpha.com. Kirk was only down around 2%. I was down around 15% even though I was in very similar positions.
Why the difference?
The main mistake I made is that I only had about $100 in free margin, which is a big no-no. I should have had $5,000 in margin available. Because I only had $100 when the markets went crazy I didn’t have any dry powder to make adjustments add additional positions to balance out the portfolio or hold positions to expiration.
Kirk was using around 50% of his available margin, so he is able to hold positions to expiration, make adjustments, sell additional premium, and keep his portfolio diversified.
It’s frustrating because while I know the rules I wasn’t following them.
Follow the Rules to Be Successful
To be successful trading options long-term there are several inviolable rules: small position sizes (1-5% of the portfolio per trade), only use half of your available capital, and place a lot of trades so the probabilities work out.
There are other factors too, like using the correct strategy, making high probability trades and being on the right side of volatility, among others.
But I don’t follow the rules! I’m afraid of missing out on a trade, or I allow myself to make an exception “just this once”, or I get greedy. And it burns me every time!
So I’m putting myself in time-out.
I’m going to stop trading options for a while. I haven’t had the discipline to follow the rules that must be followed in order for the math work out in my favor and be successful.
Reason Two: I Have Less Time
Not only that but I don’t have the free time I did when I was seeking out a new, full-time career.
Even though it might be possible to trade options and work a full time job it’s hard. One is confined to placing limit GTC orders before or after work or trading over lunch. However, a lot of the market movement tends to happen in the 30 minutes after the market opens and 30 minutes before the markets close.
When I was doing a lot of trading (July-September) I didn’t have a day job. I had this website, option trading, and selling coins. I set my own schedule.
Now I’m on the road or in appointments 8-9 hours a day during trading hours and I rarely have time to place 3-4 trades 30 minutes before the markets close. I don’t have time to make the appropriate adjustments to existing positions and I don’t have time to look for new trade opportunities.
I need a more passive approach.
Covered Calls
So I’m winding down my existing option positions. I’m also increasing holdings in some of my Value Stock Picks and selling some covered calls on them.
Covered calls they work like this: first buy shares of a stock, say 100 shares of Acme Amalgamated for $40/share. Then sell an out of the money (out of the money for a call option contract would be a contract with a strike price above where the underlying stock is currently trading) call contract for a theoretical $100 premium. 10% out of the money would be a $44 strike price.
A call contract legally obligates the call option seller to sell 100 shares of the underlying stock to the option contract buyer at an agreed upon price (the strike price) at any time before the contract expires.
For a more in-depth introduction to covered calls I suggest checking out Investopedia.
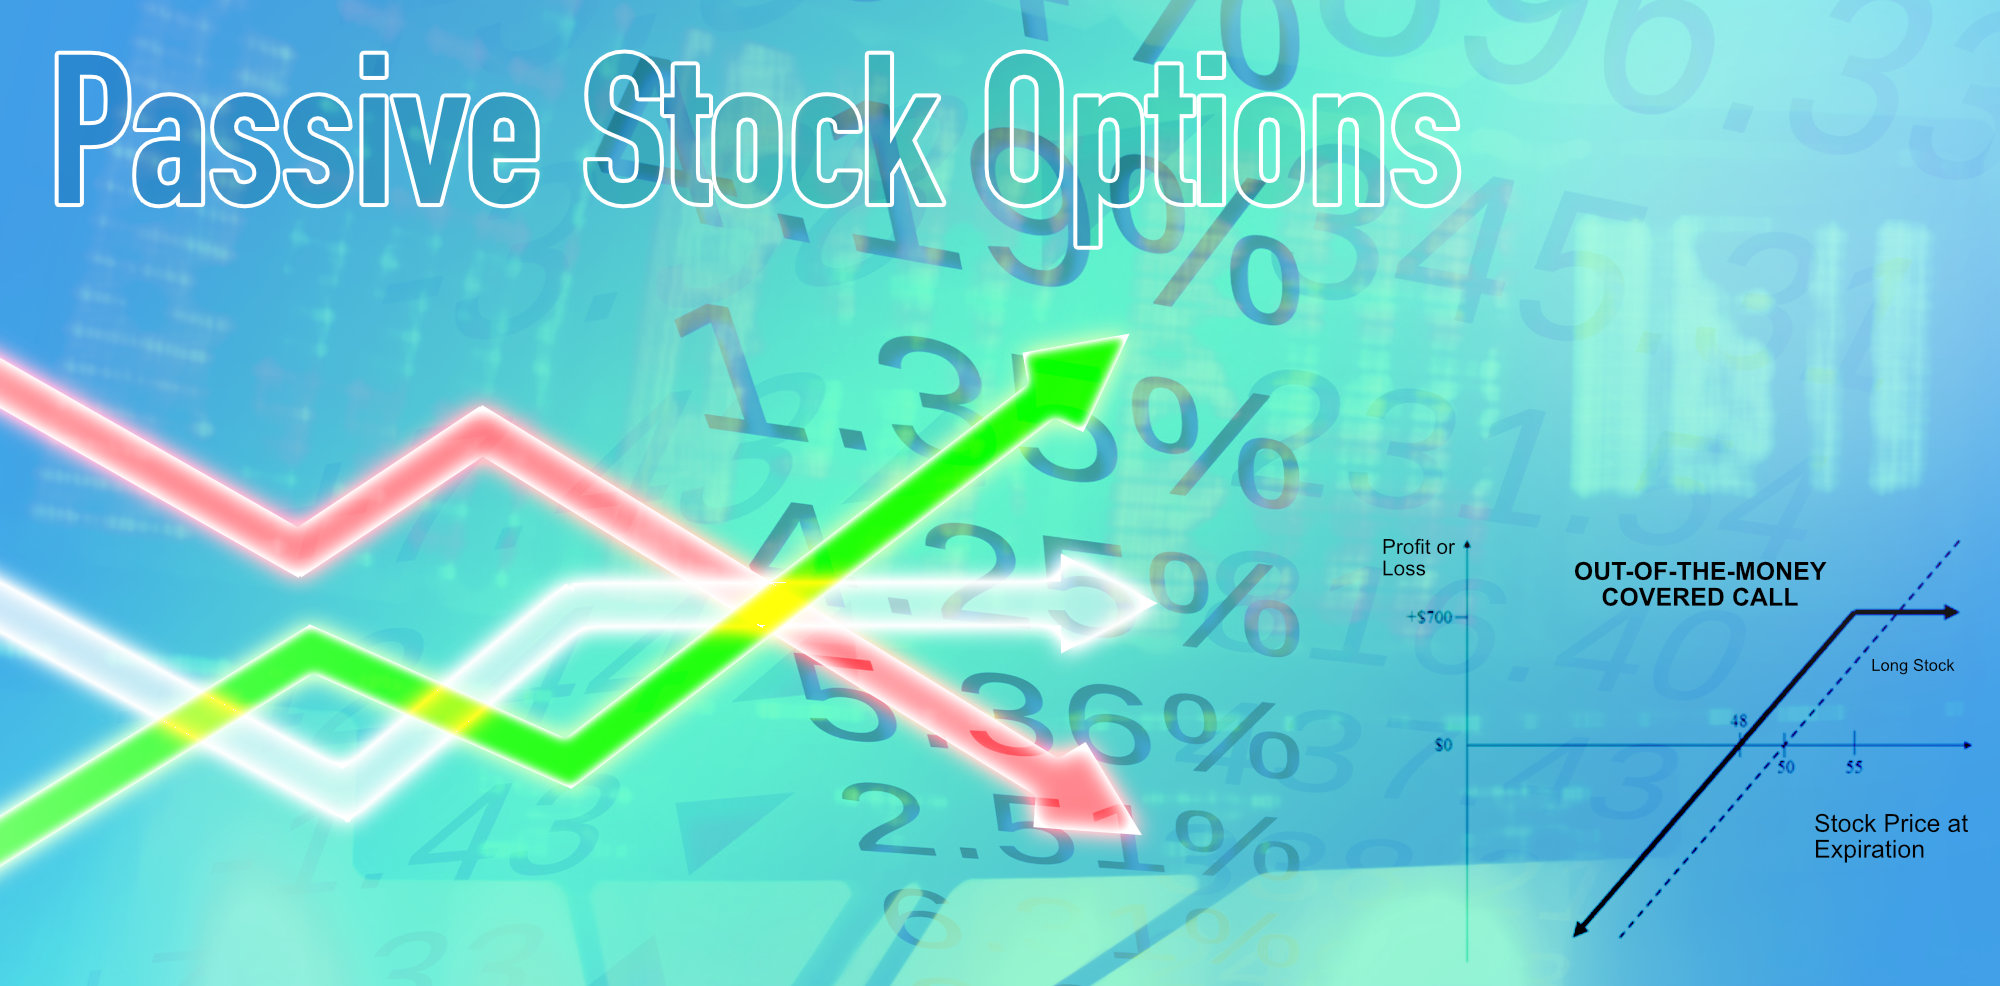
With the covered call approach, I sell an out of the money call with a strike price about 10% above where the stock is currently trading, with a contract expiring 30-60 days out, and I buy 100 shares of the underlying stock. This provides some downside protection, regular income (from the option premium) and the only downside versus owning the stock outright is gains are capped at 10% until the contract expires.
With covered calls three things can happen.
1) The stock goes down
In the above example, the stock price could drop as low as $39 at the time of expiration and the position would still break even. Because even though $100 would be lost on the price of the stock (if one were to sell) the call option would expire without being exercised and the $100 premium is still retained.
If the stock fell below $39 a loss would occur, but it would be $100 less than it would otherwise be.
2) The stock goes up or down a small amount, or stays the same price
A $100 profit would be realized plus or minus the gain or loss of the stock. If the stock price was below $44 at expiration the sold call would expire worthless and not be exercised.
3) The stock goes up beyond the strike price
In this case the position would return about 10%. It would be $400 gain plus the $100 option premium. One could either close out the call contract for a wash/loss or just let the position get assigned and the 100 shares of ACME bought for $40 per share would get sold for $44 per share.
So by selling covered calls, you give up some upside potential in exchange for some downside protection and recurring income.
But if I could make 10% every 60 days I’d be thrilled. Lets say the stock is on a tear, and it goes up 15% in the first 30 days and I get assigned, I’d still make 10%. I could then buy the stock back and sell another covered call 10% out of the money, at the end of 30 days the stock goes up another 15%, I would have still make an additional 10%, etc.
I think it is a good strategy if you can execute it correctly. Plus it doesn’t take a lot of time.
Some important elements:
1) Picking a good stock
I want to sell covered calls on stocks (or ETFs) that I want to hold for the long term. I’ve previously talked about what metrics I use for selecting stocks.
Another strategy, for example, is to buy an S&P 500 ETF like SPY and sell covered calls on it.
2) Discipline
You need to limit risk and diversify in non-correlated assets. It’s a temptation to buy into the latest hot stock and sell calls on it, or try to use too much leverage on a position. Another temptation could be buying too much stock in a given company or industry.
I would like to go back to trading options in a more active way someday. And I’m not saying I won’t make the occasional earnings trade but if I get back into actively trading options it will require puritanical adherence to the rules.