What is a 60/40 asset allocation? I’ll take a quote from an article on my favorite online finance wiki, investopedia:
For many years, a large percentage of financial planners and stockbrokers crafted portfolios for their clients that were composed of 60% equities and 40% bonds or other fixed-income offerings. And these portfolios did rather well throughout the 80s and 90s. But a series of bear markets that started in 2000 coupled with historically low interest rates have eroded the popularity of this approach to investing. – “Why a 60/40 Portfolio is No Longer Good Enough“
With that in mind, I’ve found a delightful free tool called Portfolio Visualizer that I’ve been using to backtest various asset allocation strategies.
Today I’d like to share a few basic ones to provide some food for thought. Each of these portfolios is modeled for annual rebalancing, meaning assets would be bought and/or sold each year to retain the original allocation percentages.
Portfolio 1: 100% Allocation to US Stocks
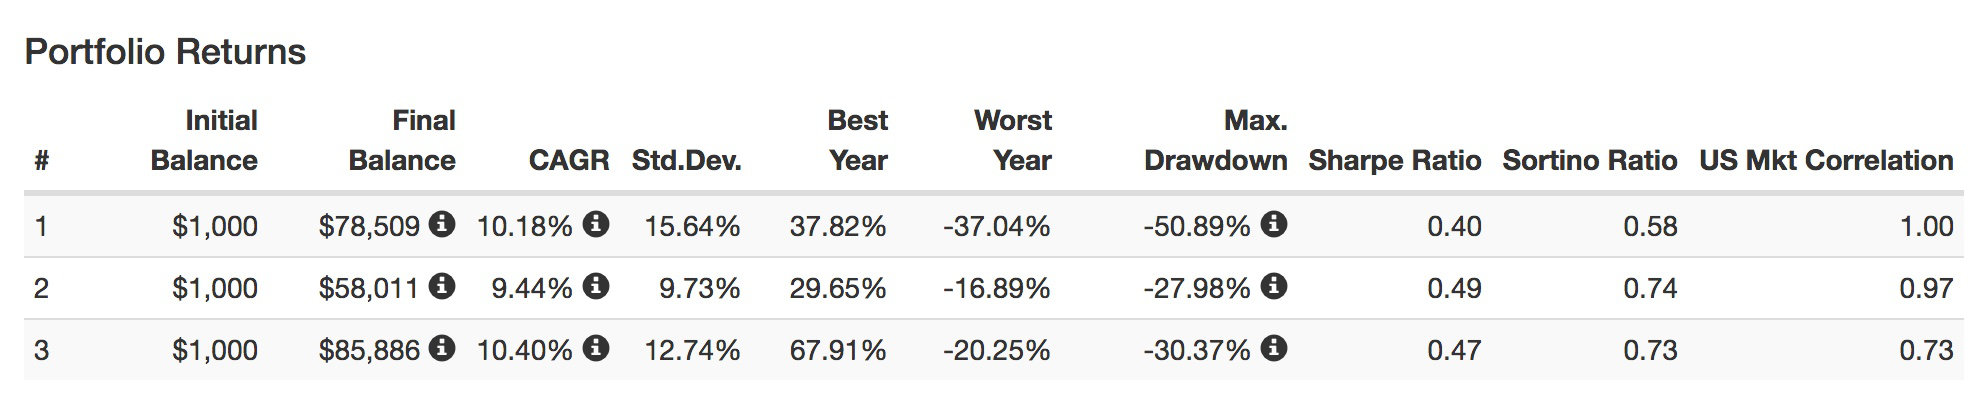
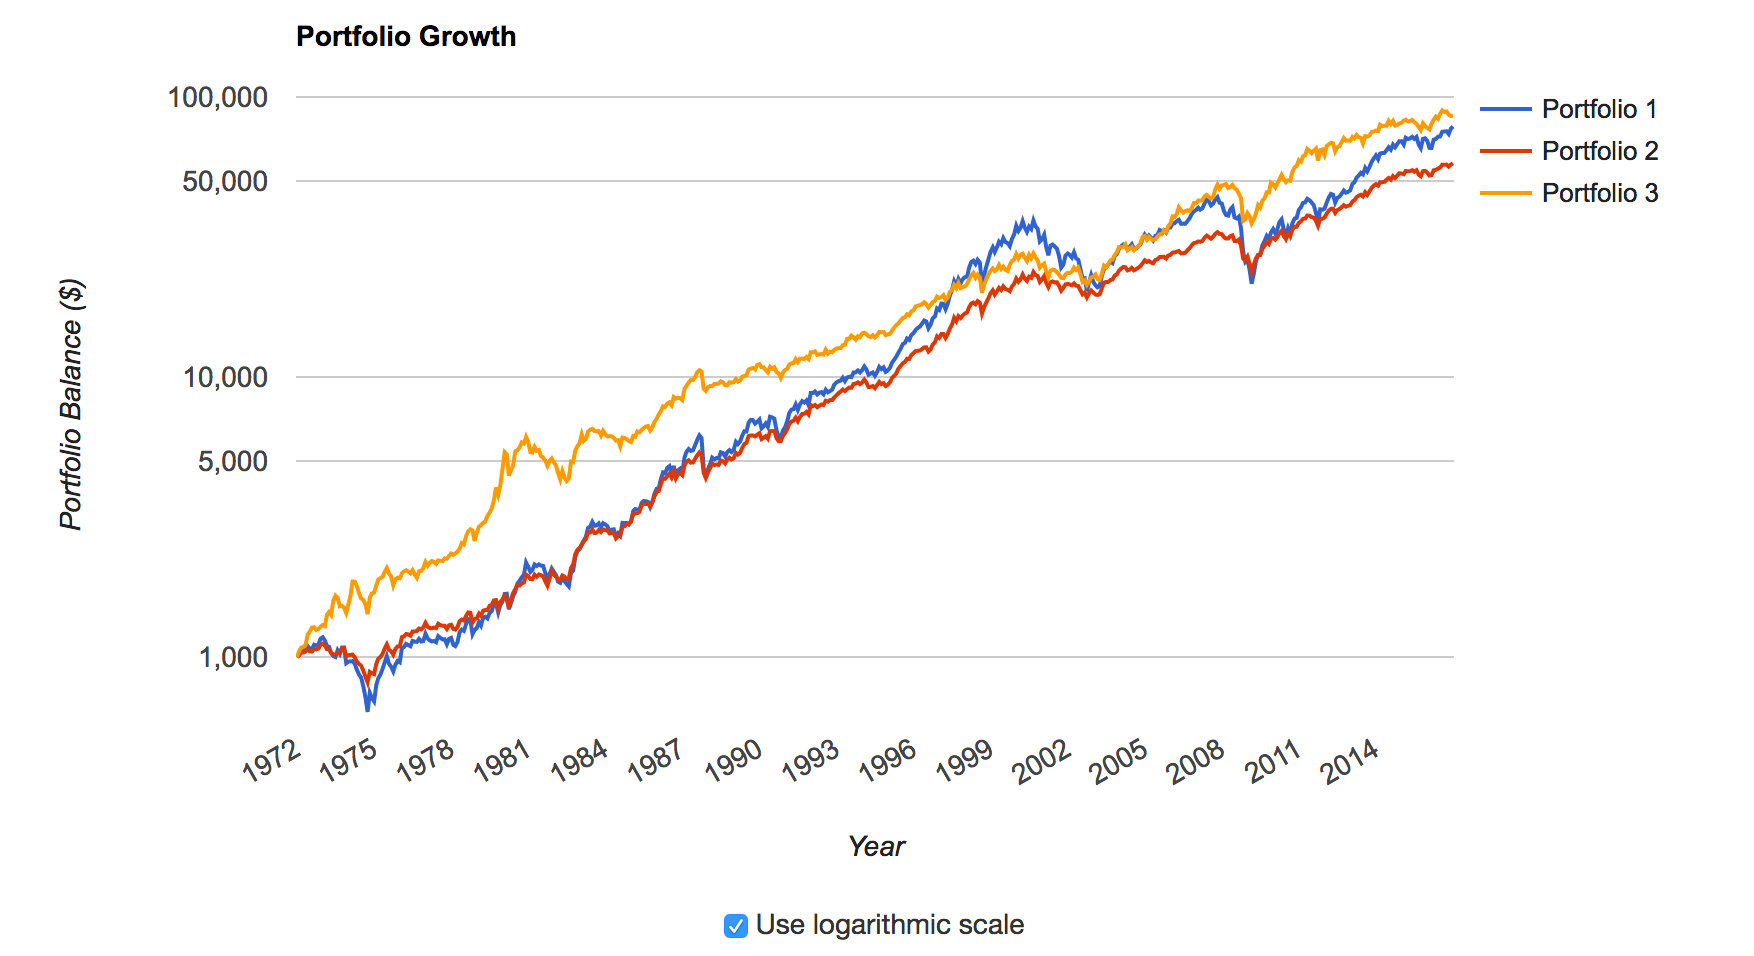
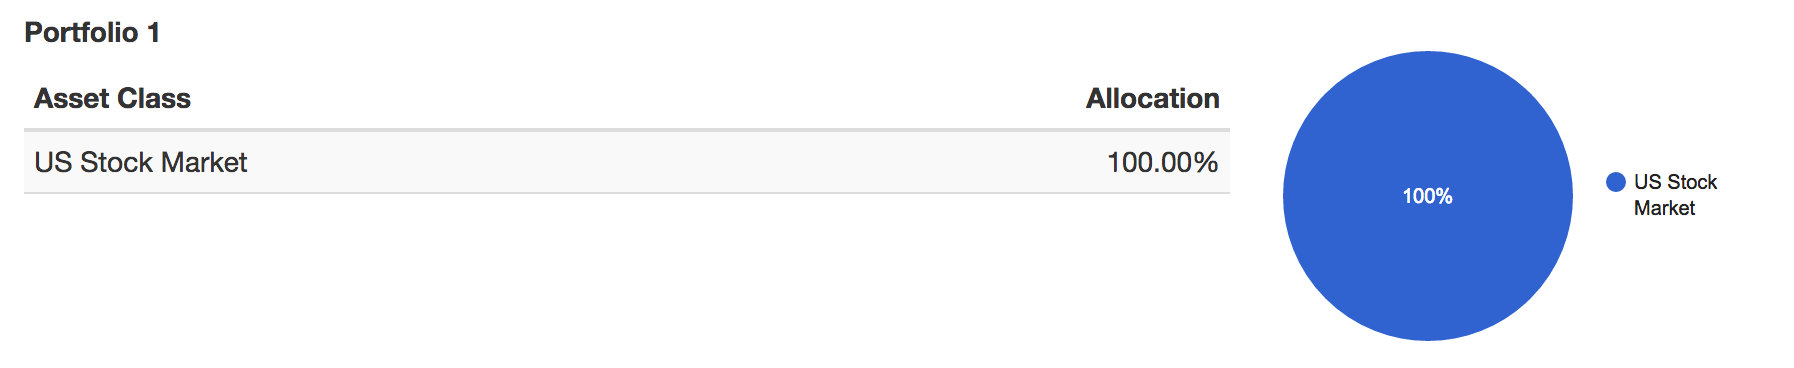 Using this tool, you can see that if in 1972 you invested $1,000 in US stocks, it would grow to be worth $78,509 at the end of 2016, representing a compound annual growth rate (CAGR) of 10.18%. You would have had to endure a drawdown of 50.89%, from November of 2007 through February of 2009. During this crisis the portfolio would have gone from $43,886 down to $21,551.
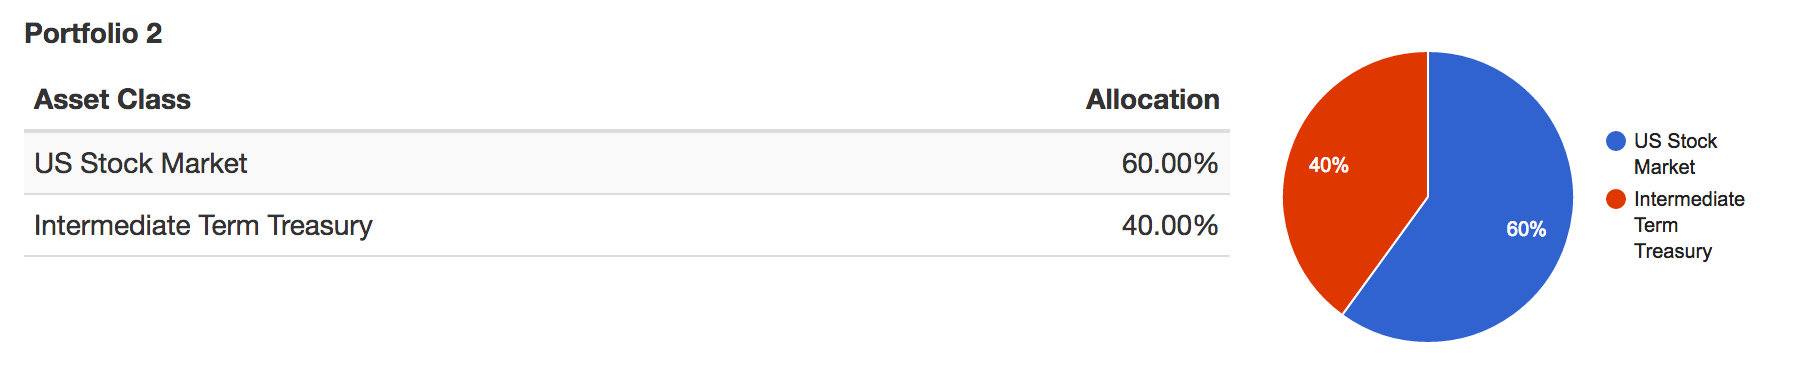
Portfolio 2: 60/40 Asset Allocation of US Stocks and Bonds
 Most people don’t have the iron stomach needed to hold onto their stocks while their portfolio drops by 50%.
Enter the 60/40 asset allocation.
A traditional allocation in the investment community is (or has been) 60% stocks 40% bonds (in this case I used Intermediate Term Treasuries). The thought being that if stocks are going up, bonds are going down, but also that if stocks are going down, bonds will go up. If you did this 60/40 allocation starting in 1972, again with $1,000, the 2016 value would be $58,011, the CAGR would be 9.44% and the 2008 drawdown would have been around 28%.
So you give up $20,500 in exchange for some peace of mind.
Portfolio 3: 60/40 Asset Allocation of US Stocks and Gold
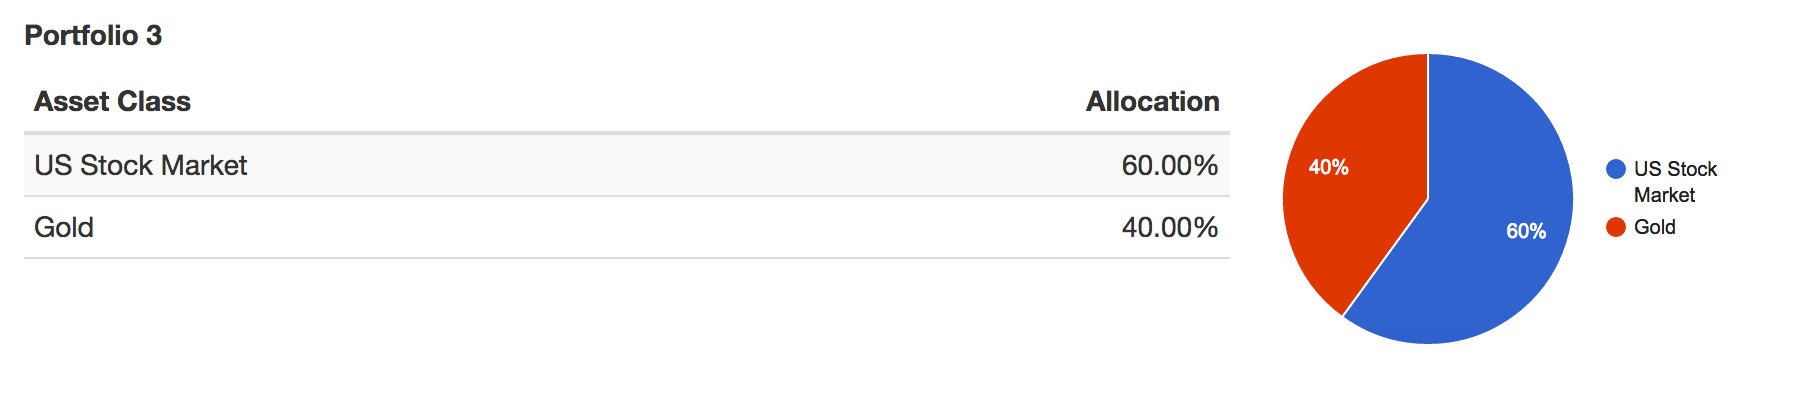 I think that US debt has nowhere to go but down. And I’ve never been particularly fond of loaning the government money, through treasuries or otherwise, so I thought: what if one replaced the 40% allocation to bonds with my favorite yellow metal?
With this allocation the $1,000 invested in 1972 would grow to $85,886 by 2016, the CAGR would be 10.40% and the maximum drawdown would have been 30% back in 1980-1982.
So over the 1972-2016 timeframe, a 60/40 asset allocation of US stocks and gold would have performed better than either 100% US stocks or a 60/40 US stock and bond portfolio.
You can always cherrypick allocations in hindsight that will outperform. But I think it is an interesting datapoint in the case for gold.