EOS is a case study in how the “best” technology doesn’t always win. When compared to Ethereum on several metrics, EOS is far superior, it has processed up to 3,000 transactions per second compared to Ethereum’s 15. It already utilizes a more eco-friendly delegated proof-of-stake consensus mechanism.
Block.One, the originators of the EOSIO software, raised over $4 billion in the largest initial coin offering ever. At one point the market cap of EOS was over $17.7 billion–EOS had a lot going for it.
Of course there are other factors and market participants in a free market ultimately determine what technology is the “best” based on what factors (or perceived factors) they most highly value.
The creators of EOSIO, the software that powers EOS, Dan Larimer, Chief Technology Officer at Block.One and Block.One in general managed to alienate the cryptocurrency community. EOS was put forth as an Ethereum killer or “Ethereum On Steroids”. This likely ticked off a lot of whales who were heavily invested in Ethereum. There were also some decisions made that led people to think EOS is not very decentralized.
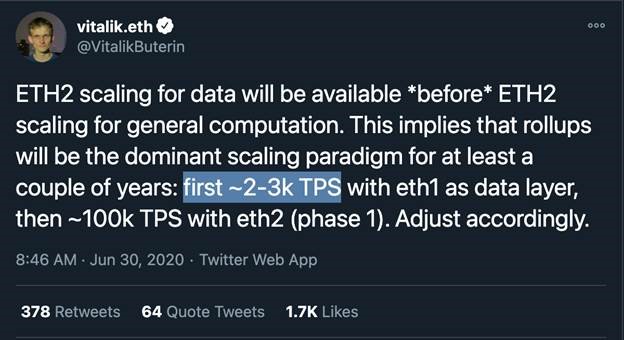
EOS had a chance to supplant Ethereum, but seems to have blown it. Now the Ethereum community is planning several major upgrades to the network in the form of Ethereum 2.0 (also known as eth2, also known as Serenity). The main changes includes transitioning to a more energy efficient proof-of-stake consensus mechanism and side-chains that are purported to increase the transaction per second capacity of the network to upwards of 100,000.
If this can be pulled off, Ethereum 2.0 would in my opinion be well positioned to capitalize on superior technology and lead the distributed financial sector forward.
I also think it is possible for Ethereum to overtake Bitcoin. One of the reasons I was initially drawn to Ethereum back in 2015 is that it has non-monetary use whereas Bitcoin does not. However, because of its technological limitations, I didn’t see Ethereum in widespread use. Ethereum 2.0 could change that.
Transactions Per Second
EOS is currently superior to Ethereum in terms of transaction throughput. EOS has processed as many as 4,000 transactions per second (TPS) and can theoretically handle more. Ethereum meanwhile, putters along at 15 TPS. Ethereum 2.0, using side chains in a process called sharding, could increase the throughput to 100,000 transactions per second, or roughly 4 times that of Visa.
Market Capitalization
As of writing this article, EOS has a market cap around $1.2 billion. It is rarely mentioned in “Ethereum Alternative” articles. While EOS was once a top 10 cryptocurrency by market cap, it has fallen down to 29. Ethereum in contrast has long been the number 2 cryptocurrency second only to Bitcoin. Ethereum accounts for just under 20% of the total cryptocurrency market (compared to ~46% for Bitcoin. Ethereum has a total market capitalization of $355.7 billion.
Consensus Mechanism
Distributed cryptocurrencies need a consensus mechanism so that the various nodes can agree on the current state of the system. Ethereum 2.0 is in the process of moving to proof-of-stake. EOS was designed from the beginning with a delegated proof-of-stake (DPOS) consensus mechanism. The difference being that with eth2, anyone with enough Eth can be one of the validators eligible for random selection to add blocks whereas in DPOS, one must be elected to one of 21 block producers.
Decentralization
One of the appeals to cryptocurrencies is they are not controlled by a small group of actors with oligarchical power. With validators numbering in the thousands and assigned pseudorandomly, Ethereum 2.0 does seem to be much more decentralized than is EOS.
Developer Community
Technologies like Ethereum and EOS allow for distributed apps or dAPPS. In order to have apps you need developers to create and maintain them. According to this report, EOS is losing developers, while other dAPP platforms like Ethereum and Polkadot are gaining developers. So EOS developer community is getting smaller.
Name Recognition
No cryptocurrency can complete with Bitcoin for name recognition, but Ethereum is strongly in second place. Big names in the financial world will mention Ethereum whereas projects like EOS are relegated to those inside the cryptocurrency community.
Summing it All Up
As I wrote above, when EOS came onto the scene Block.One had a lot of money and EOS had a lot of momentum. But poor decisions and perception has blown the chance. Now, developers are dropping and the price going no-where. EOS’s technological advantages don’t seem to matter. Plus once eth2 is released, those advantages won’t exist.
In order to for eth2 to launch a lot of things have to go right. However, there are a lot of folks working to make sure it does. If there are delays or issues, those could result in selloffs that will represent buying opportunities.
Interest rates, or the price of borrowing money are a key element of any modern economy. I keep a weather eye on the ten year US treasury note yield.
Treasury yields don’t just influence how much the government pays to borrow and how much investors earn by buying government bonds. They also influence the interest rates that individuals and businesses pay to borrow money to buy real estate, vehicles, and equipment. Treasury yields also tell us how investors feel about the economy. The higher the yields on long-term U.S. Treasuries, the more confidence investors have in the economic outlook. But high long-term yields can also be a signal of rising inflation in the future.
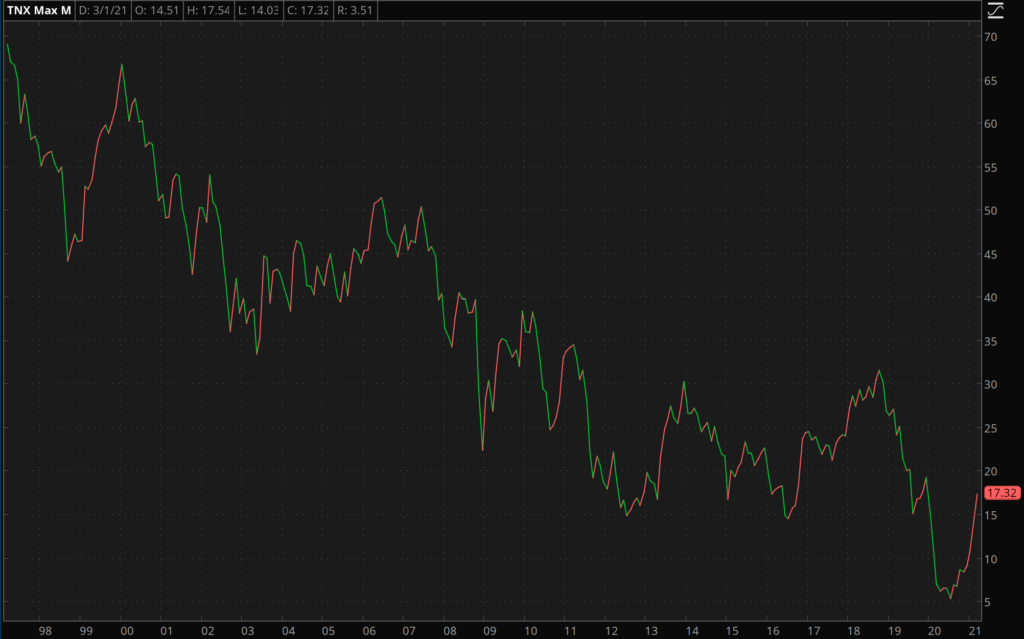
As I write this the 10 year treasury yield is 1.73%. This is absurdly low from a historical perspective. For example, back in June of 2007 the 10 year yield was at 5.3%.
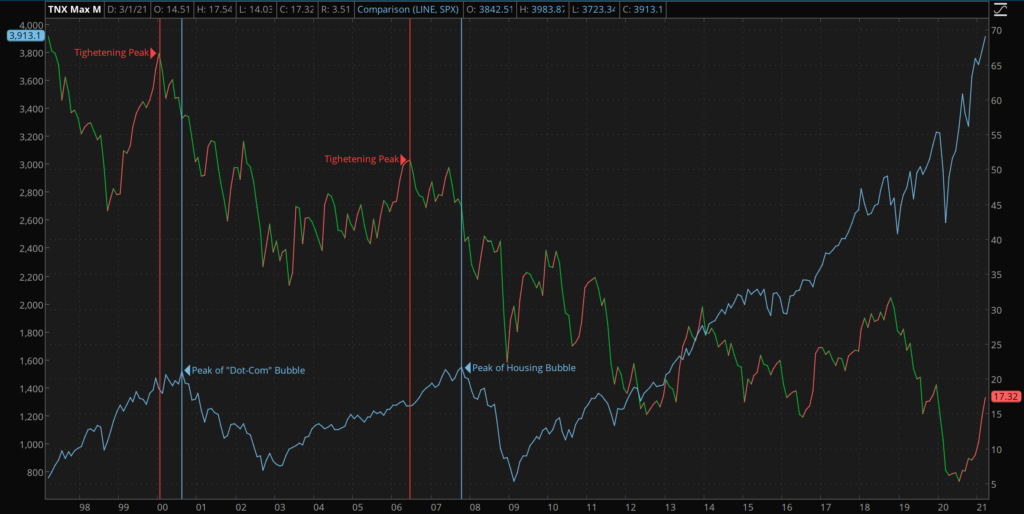
As you can see from the chart below, interest rates have been grinding steadily downwards for the past 20 plus years.
The 10 year yield bottomed out at 0.398% in March of 2020. Since then the 10 year yield has risen rather rapidly.
I think most people would agree inflation is at least about 2% per year. I don’t know what the real rate of price inflation is, but I suspect it is north of 2%. But for the sake of argument we’ll say dollars are worth 2% less each year.
So for the privilege of loaning the government money for 10 years, you’re going to get 1.73% in interest, even though the dollars will be worth 2% less. Now getting 1.73%, all else equal, is better than getting 0%. But it still doesn’t make sense that effective or real interest rates are negative, because while nominally you would be get more money back from the government, in real terms, you’d be getting paid back less. A normally functioning market isn’t supposed to work this way.
Interest is first supposed to compensate the lender for not having access to that money and two, to compensate them for the risk they are taking because the borrowing might not repay the loan and the lender might lose part or all of the money loaned.
In a free market, rising interest rates would be fine. It would just mean that lenders are demanding higher compensation in exchange for loaning their money.
Because US markets are unhealthily influenced (to use a polite term) rising interest rates pose several problems:
In the aggregate most entities in the United States are heavily indebted, starting with individuals and families all the way to companies, State Governments and the Federal Government. Most States and the Federal government spend much more than they take in via taxes. The only way to make up the difference is to borrow the money by issuing debt. With interest rates rising, individuals, companies and governments have to pay more to borrow money. So these entities will either need to cut back on spending, or the amount of debt they accrue with increase.
A lot of the elements of the US economy are accustomed to cheap money. There has been a large boom in housing demand due in part to people wanting to live in a nicer place since their ability to spend time outside the home has been very limited, combined with low interest rates that make it less expensive to borrow money to buy a house. The mortgage industry and real estate industry operate within the context of these low rates. If rates rise, that will put downward pressure on housing demand, and on the margin, people will not be able to service a mortgage at the higher interest rates.
Stocks, particularly growth stocks in the technology sector have gone up a lot due to low interest rates. There are a variety of reasons for this. Low interest rates also mean it is inexpensive to borrow money to buy stocks with. Margin trading has also gone mainstream thanks to brokers like Robinhood. Higher interest rates means people can’t borrow as much money to buy stocks and all else equal this would put downward pressure on stock prices.
With interest rates rising, bonds are more attractive. With rates effectively at zero nominally and zero or negative in real terms, people reach out along the risk curve. People who would be in government issued bonds might look to corporate bonds, which are considered riskier but pay a higher interest rate, those in corporate bonds might look to stocks, etc. With rising interest rates, if bonds do start paying a decent return (as judged by the investor) some folks on the margin will rotate money back into bonds.
I turn to CNBC to get a sense of what the mainstream, accepted narrative is. The narrative from folks over at CNBC is that the market is concerned about inflation, and so people are selling bonds to buy other assets and effectively demanding a higher rate of return in exchange for loaning the government money. There is also a theme that is repeated that rising rates are bad for the more speculative growth technology stocks.
What Impact Could Rising Rates have on Stocks?
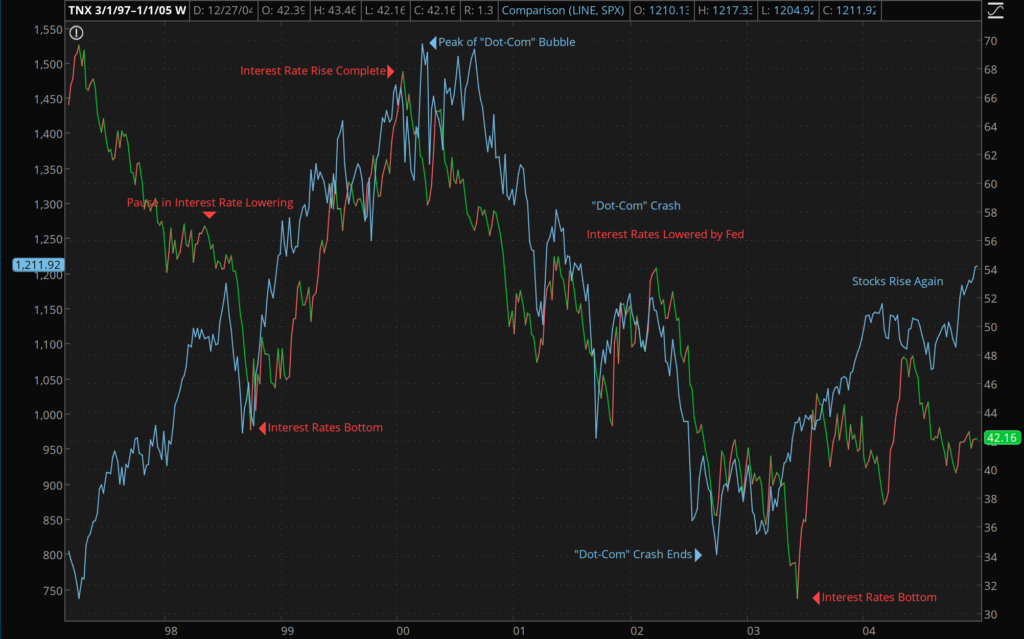
I’m comparing certain periods of rising yields (using the 10-year to represent yields) and the ETF QQQ to represent stocks. QQQ is the 100 largest non-financial stocks in the NASDAQ. These are the stocks that CNBC wisdom would indicate would be most impacted by rising rates.
The big “dot-com” crash according to me, can be summarized thusly: the bubble was fueled by artificially low interest (courtesy of Allan Greenspan’s Federal Reserve), “investors” used cheap money to speculate on internet technology stocks with little or no earnings. When the Fed then tried to raise rates, the low interest rate “air” that was blowing the bubble was limited, causing the bubble to pop and stocks to crash.
The chart below shows the “QQQs” rising as interest rates fell. The Fed stopped cutting rates in September of 1998. The QQQs continued to rise, even as interest rates rose. But then technology stocks peaked in March of 2000 and then proceeded to crash 43% from this peak, until bottoming out in September of 2002. In order to get the “Dot-Com” crash to stop, the Fed had to lower interest rates even further.
Fast forward, the Fed then tried raising rates again, albeit very slowly, and in 2007-2008 the housing market crashed and the Fed had to cut rates.
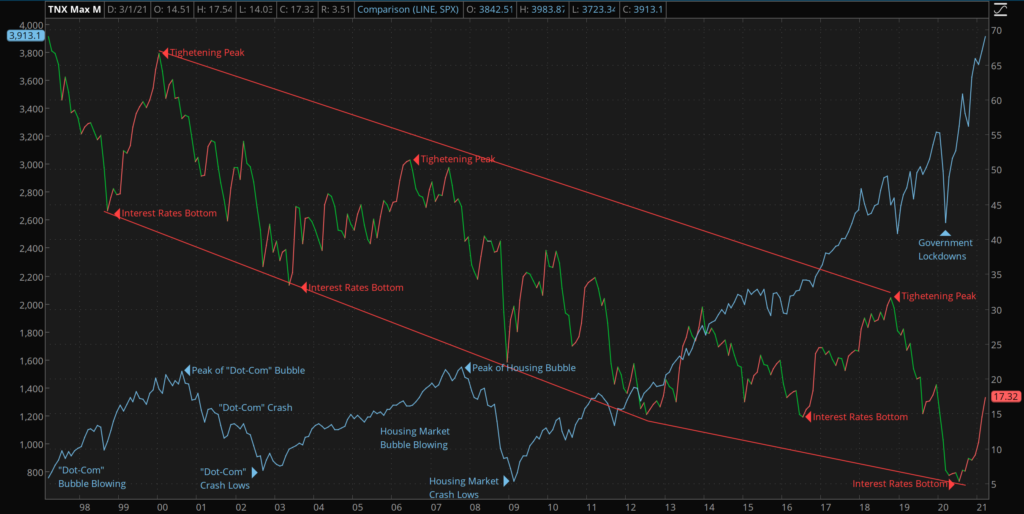
There hadn’t been a major crash since 2008, up until the March 2019 government lockdowns shut down much of the economy throughout the world. The yield on the 10 year note has not gotten back above 4.174% since the housing bubble popped.
The lowest rates have gotten since March of 1997 is 0.398%, which happened in March of 2020. Rates have since risen to their current level of 1.732%. As the talking heads will point out, these are still historically low rates. That is true.
But amount of debt in the system has never been this high. In 2000 when the 10 year note yielded 6.5% the US had a debt to GDP ratio of 58.7% and the national debt was “just” $5.7 trillion. US National debt is now over $28 trillion and the debt to GDP is now over 129%.
Can the US afford to pay 6.5% on 10 year debt?
The other factor is the pace at which rates have risen. In one year the 10-year note yield has gone from a low of 0.398% to 1.732%, that is a 335% increase in 365 days.
In the lead up to the dot com crash, the 10 year yield went from 4.4% in September of 1998 up to 6.82% in August of 2000. That is a 55% increase over 700 days.
In the lead up to the housing bubble crash, the 10 year went from 3.29% in May of 2003 to 5.25% in June of 2006. That is a 59% increase over 1127 days.
Does rapid pace of this relative increase matter?
If the past is any indication the impact isn’t going to be immediate. In the past two major financial crashes, interest rates were already dropping again before the peak in the QQQs. Rates peaked in January of 2000 but stocks didn’t start selling off until August of 2000. In the housing bubble, rates peaked June of 2006 and the QQQs didn’t start selling off until October of 2007. You can see the delay visually in the chart below.
I certainly don’t know if rising rates will cause a stock market correction. Perhaps this time is different. If I could time the markets I would be much richer than I am. But rising rates are something to keep an eye on and in the past they have preceded stock market selloffs.
It does seem likely that the Federal Reserve will never be able to normalize interest rates. There have been periods of rising rates, but the clear trend is downward. The 10-year came close to zero in July of 2020. In the next crisis, rates will probably have to go negative.
Will anyone besides the US Federal Reserve want to loan the US Government money for 10 years at a negative nominal rate (and who knows how negative real rate)?
Depending on where you get your news you might think the fossil fuel industry is going the way of the dinosaur. This combined with other factors have made investments in oil and gas companies like Exxon Mobil (XOM) and Royal Dutch Shell (RDSB) unpopular.
I’m long XOM and RDSB and I think these companies are undervalued and will produce solid returns over the next 10-20 years.
Why would I invest in these companies when oil and gas industry are dying?
The fact of the matter they aren’t dying. The demand for oil and gas is increasing. You might not guess that from the price of oil and natural gas.
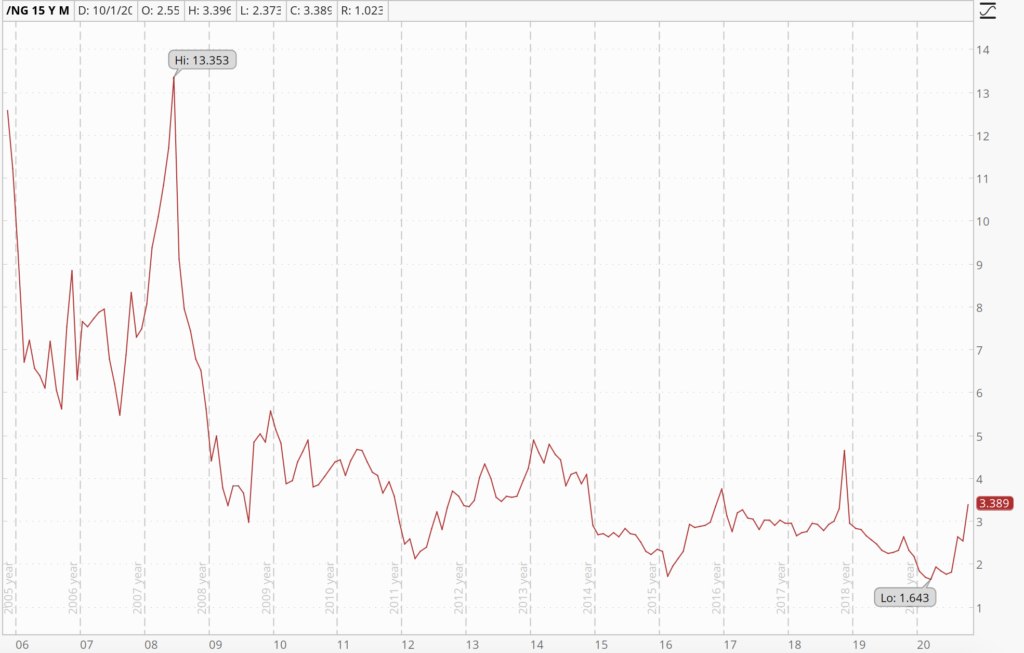
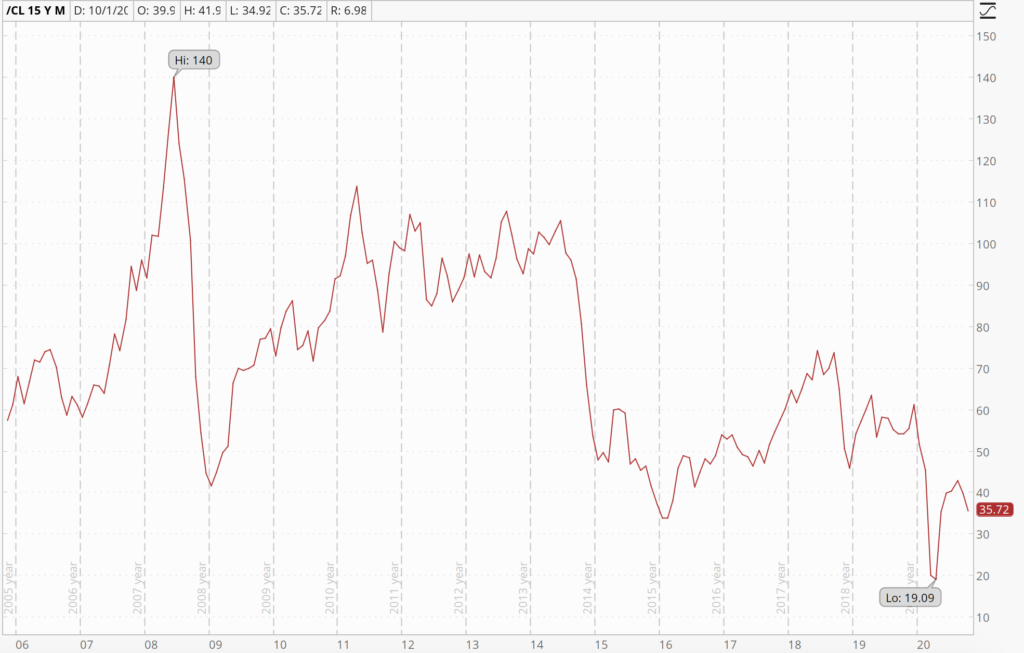
Natural Gas prices have cratered over the last 10 years Oil prices have also trended down from the 2007 high of 140
The reason for these price declines is because the supply of oil and gas is so robust. The reason I know that is because as prices are falling, consumption of oil and gas continues to increase. When supply increases faster than demand prices will fall.
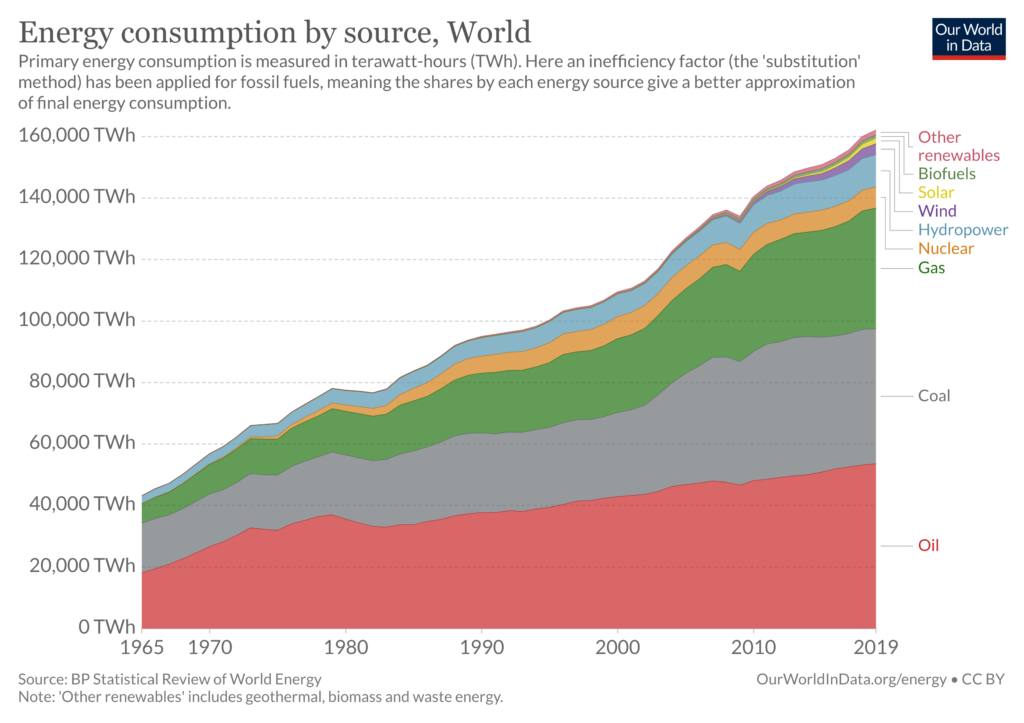
It is important thing to understand the world continues to consume more and more energy. 2009 was an exception to that rule and 2020 will be as well but the long term trends over the past 10 years and going back as far as I have data is that energy consumption keeps going up. Oil and gas consumption keeps going up as well on an absolute basis.
But the lockdown induced economic slowdown of 2020 will not last forever. Eventually the world will learn to live with the virus and the demand for energy will continue the long term trend of growth.
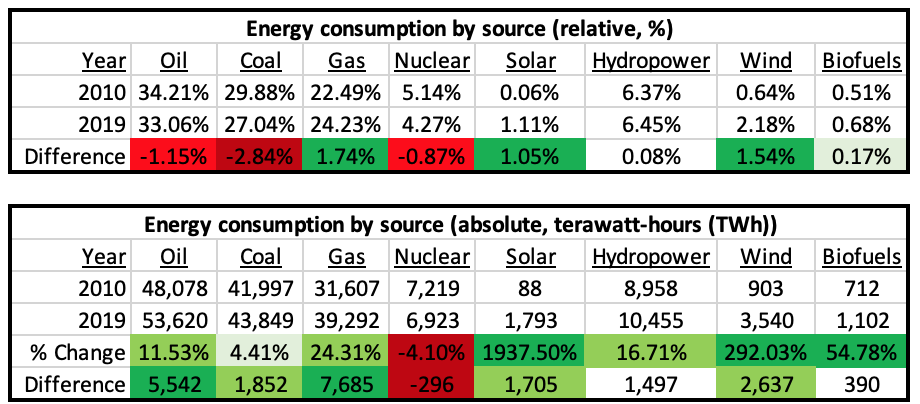
So what technology will be used to meet that demand? The trend has been an increase in energy coming from solar and wind. But they remain niche players on the global scene. As of 2019 Solar accounts for 1.11% of global energy consumption and wind accounts for 2.18%. These small industries have indeed been growing dramatically. The amount of terawatt-hours (TWh) of energy provided by solar went up 1,937.5% and wind went up by 292%.
On an absolute basis since 2010 the largest source of growth has actually been natural gas. Gas also had the largest increase on a relative basis, growing from 22.49% of energy consumption to 24.23%. However, coal and oil still remain the largest sources of energy and while they are shrinking on a relative basis they are both still growing on an absolute basis.
Date Source: https://ourworldindata.org/grapher/energy-consumption-by-source-and-region?stackMode=absolute&time=earliest..latest
The biggest loser since 2010 has actually been nuclear power. Nuclear has declined on both an absolute and relative basis. Nuclear provided 5.14% of global energy as of 2010 and has dropped down to 4.27%. On an absolute basis it has dropped from providing 7,219 TWh of energy and as of 2019 is down to 6,923 TWh. But even though nuclear energy consumption is declining, nuclear still provides more energy than solar and wind combined.
I think these trends will continue over the next 10 years. Solar and wind will continue to grow on a relative and absolute basis. But I think the relative growth they pick up will largely be from coal and perhaps in small part from nuclear unless the attitude towards nuclear technology changes. I believe natural gas will continue to grow on a relative and absolute basis. I further believe oil will continue to increase on an absolute basis but may stay relatively flat to downward on a relative basis. Coal will continue to decline on a relative basis and might even start to decline on an absolute basis as well.
Wind and solar are definitely in more of a growth mode, as you can see from those huge numbers, than the oil industry. But gas is also in growth mode. I do like alternative energy companies like Next Era Energy (NEE). While NEE is in the wind and solar space they also provide power using natural gas and nuclear. I’m looking for a buying opportunity and looking for value in the alternative energy sector as well.
But that doesn’t change the fact that oil and gas stocks are trading at steep discounts and oil and gas consumption is still in an uptrend. As billion hypocrite Warren Buffet once said be “fearful when others are greedy, and greedy when others are fearful.”
There is a lot of fear in the oil and gas industry so it might be time to be greedy.
This website uses cookies to improve your experience. We'll assume you're ok with this, but you can opt-out if you wish.AcceptRejectRead More
Cookie Policy
Privacy Overview
This website uses cookies to improve your experience while you navigate through the website. Out of these, the cookies that are categorized as necessary are stored on your browser as they are essential for the working of basic functionalities of the website. We also use third-party cookies that help us analyze and understand how you use this website. These cookies will be stored in your browser only with your consent. You also have the option to opt-out of these cookies. But opting out of some of these cookies may affect your browsing experience.
Necessary cookies are absolutely essential for the website to function properly. This category only includes cookies that ensures basic functionalities and security features of the website. These cookies do not store any personal information.
Any cookies that may not be particularly necessary for the website to function and is used specifically to collect user personal data via analytics, ads, other embedded contents are termed as non-necessary cookies. It is mandatory to procure user consent prior to running these cookies on your website.