A naked short is when you sell a stock without owning it or having borrowed it first. Naked shorting stocks is supposed to be illegal in the US.
But what is shorting a stock?
Normally, if done legally, one shorts a stock by finding someone who owns, the stock, borrowing it from them (at an interest rate) selling it into the market, then if the stock goes down, one can buy it back and return the stock to the lender. In doing this the number of shares outstanding remains the same.
A naked short is when one sells a stock without first owning it or borrowing it from someone else. The the rest of the process is the same, expect one closes it out by buying the stock back.
So let’s look at a basic example I’m using simple and small numbers to highlight the concept but, if you increase the number of traders and prices and shares, the concept still applies.
Scenario A Example: Short
Acme Co. stock is trading at $1 per share and there are only 100 shares in existence. Person A owns 10 shares of Acme Co. Other people own the remaining 90 shares. They loan the 10 shares to person B so Person A now has 0 shares of Acme Co., person B pays person A interest for the duration they are borrowing the stock, and person B sells that stock into the market at a price of $1 per share to Person C. So they pocket $10 less the interest they paid. There are still 100 share in existence, 10 of which are held by Person C.
Now let’s say the price of Acme Co. stock drops to $0.90. Person B (the short seller) then buys 10 shares of Acme Co. from some other shareholder who is willing to sell for $9 in total. They give those shares back to person A to close their short. And they have just profited $1 less any interest paid.
Now some people don’t like that people can short stock because it is “betting against a company.” Now there are plenty of things I don’t care for but I don’t want to be illegal. I don’t like most of the “popular” music produced today. But I think people should be free to produce music even if I don’t like the result.
I think if I own stock, I should have the right to loan it to others to collect interest. I also think that people have the right to borrow stock from a willing lender. And if someone has borrowed stock, they should be able to sell it (provided both parties agree that the borrowed stock could be sold, and provided the shares are paid back). Since I believe in those two things it follows that people can choose to short stock.
It’s also interesting that people don’t seem to have a problem with borrowing a stock in the hopes that it goes up. Some people essentially borrow stock (using margin accounts) in the hopes that it goes up in value and they can sell it at a profit. You can’t allow people to bet on a stock going up if there isn’t someone taking the other side of the trade essentially betting it will go down.
Now, what I do think should not be allowed (because I believe it is fraud, very much akin to fractional reserve banking), is naked shorting of stock. A naked short is when you sell stock that you don’t own and didn’t borrow from someone else. This essentially introduces new shares of the stock into the financial system that never existed. A company has the right to issue stock, but a random person doesn’t have the right to issue stock in a company they don’t own or control.
So let’s look at our other example only this time it is a naked short. Again, this is illegal in the US in Europe. But it does happen through various loopholes I don’t pretend to fully understand.
Scenario B Example: Naked Short
Acme Co. stock is trading at $1 per share and there are only 100 shares in existence. Various people own the 100 shares. Person B’s broker allows person B to sell 10 shares of Acme Co. stock in exchange for a fee and/or interest. The broker does not own any shares of Acme Co.. Person B sells that stock into the market at a price of $1 per share to Person C. So they pocket $10 less the interest they paid. There are now 110 share in existence, 10 of which are held by Person C.
Now let’s say the price of Acme Co. stock drops to $0.90. Person B (the short seller) then buys 10 shares of Acme Co from some other shareholder who is willing to sell for $9 in total. By buying 10 shares, this closes out their short position. And Person B has just profited $1 less any interest paid and/or fee.
So that is my understanding of you could short a stock beyond the number of shares issues by the company, through naked shorting.
Now the actual mechanics of stock trading behind the scenes is more complex. Trades don’t settle on the same day. Once a trade is closed, it still takes a few days before the trade is settled. Brokers allow buying and selling and they don’t true up their books until later. I don’t pretend to understand all these mechanics.
Scenario C: Short Squeeze
So let’s look at scenario B, only the price of Acme Co. goes up.
The first part is the same:
Acme Co stock is trading at $1 per share and there are only 100 shares in existence. Various people own the 100 shares. Person B’s broker allows person B to sell 10 shares of Acme Co. stock in exchange for a fee and/or interest. The broker does not own any shares of Acme Co.. Person B sells that stock into the market at a price of $1 per share to Person C. So they pocket $10 less the interest they paid. There are now 110 share in existence, 10 of which are held by Person C.
But now: let’s say the price of Acme Co. stock rises to $1.10. Person B (the short seller) then buys 10 shares of Acme Co from some other shareholder who is willing to sell for $11 in total. By buying 10 shares, this closing out their short position. And Person B has just LOST $1 less any interest paid and/or fee. Now $1 isn’t a big deal and Person B in case case can come up with the money to pay it. But on a large scale this can be a big problem.
If the price of Acme Co. had risen rapidly to say $20. Short Seller Person B would need to come up with $10 to close out their short position. If instead of being short $10 worth of stock, perhaps they were short hundreds of thousands of shares and the losses are now in the millions. There is also a problem of liquidity. Maybe no one wants to sell their stock in Acme Co., they are happy to hold it and see if it goes higher. Maybe more buyers come in and are willing to buy in at $20, driving the price up even further. Person B might get into trouble because they might not be enough shares available to buy back and close their short position.
Brokers will often hike margin requirements when markets move quickly in one direction or another to protect themselves. The broker in scenario C where Acme Co. went to $20 might have said to the Short Seller Person B, “you have to deposit another $10 into your account or we will liquidate your position at the current market price.”
Depending on where you get your news you might think the fossil fuel industry is going the way of the dinosaur. This combined with other factors have made investments in oil and gas companies like Exxon Mobil (XOM) and Royal Dutch Shell (RDSB) unpopular.
I’m long XOM and RDSB and I think these companies are undervalued and will produce solid returns over the next 10-20 years.
Why would I invest in these companies when oil and gas industry are dying?
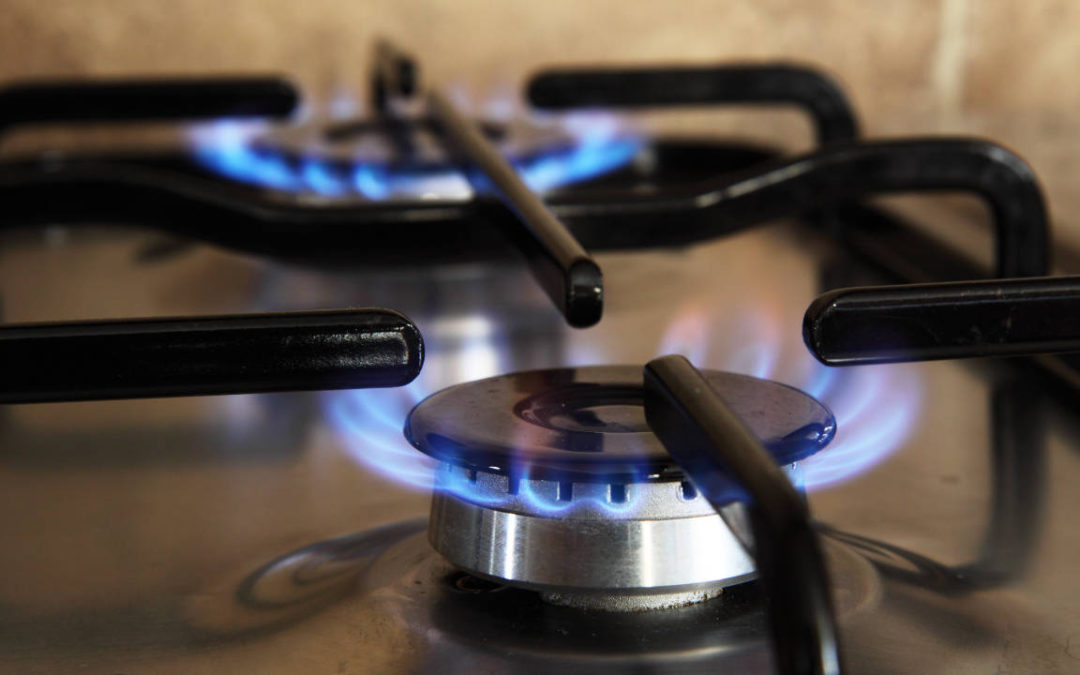
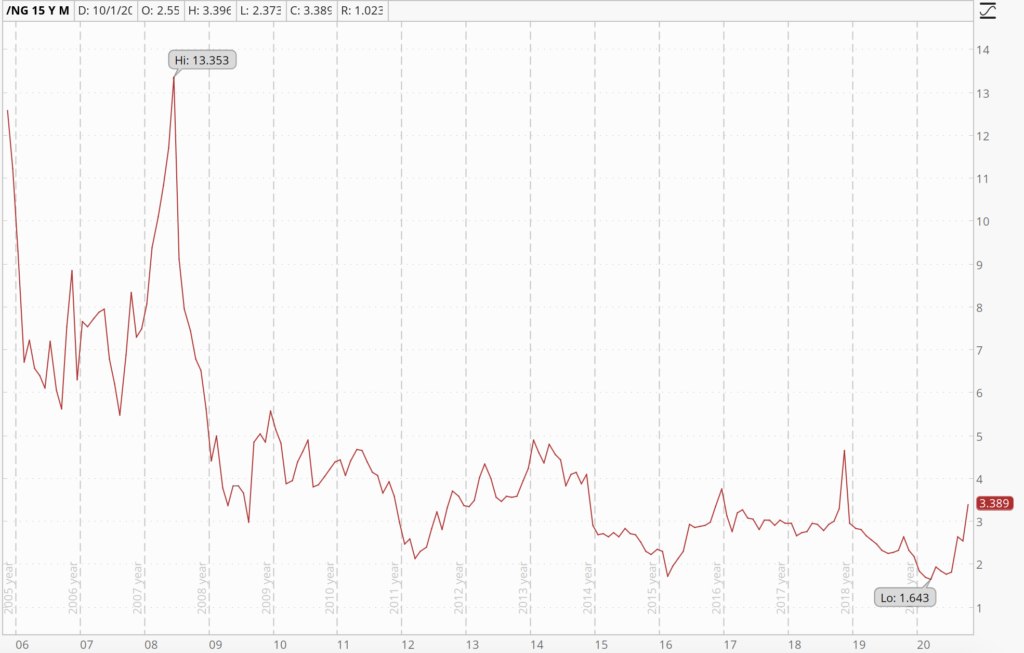
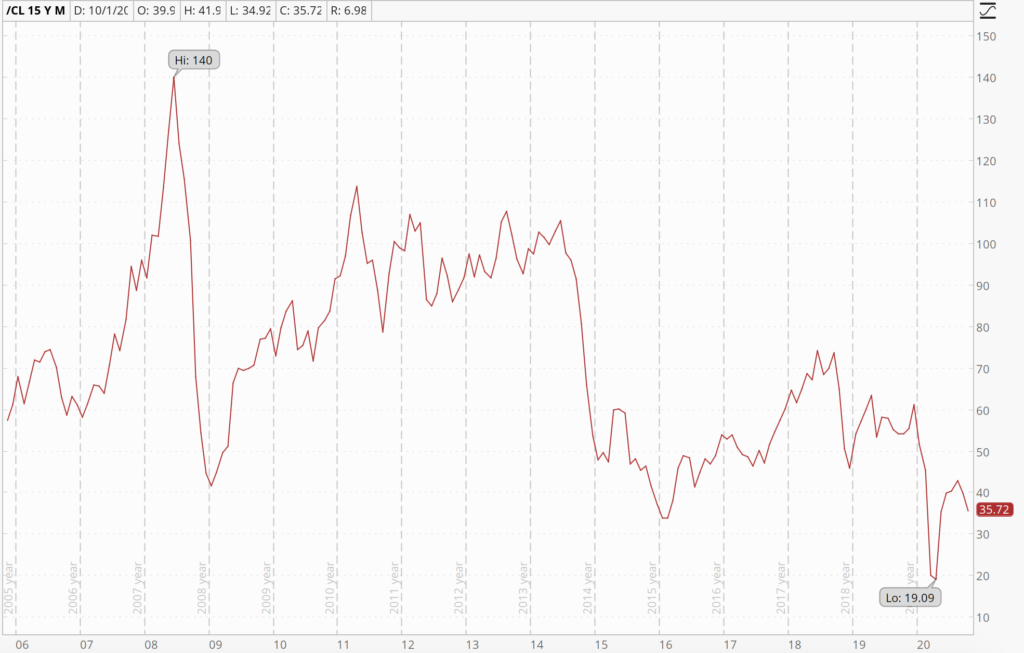
The fact of the matter they aren’t dying. The demand for oil and gas is increasing. You might not guess that from the price of oil and natural gas.
Natural Gas prices have cratered over the last 10 years Oil prices have also trended down from the 2007 high of 140
The reason for these price declines is because the supply of oil and gas is so robust. The reason I know that is because as prices are falling, consumption of oil and gas continues to increase. When supply increases faster than demand prices will fall.
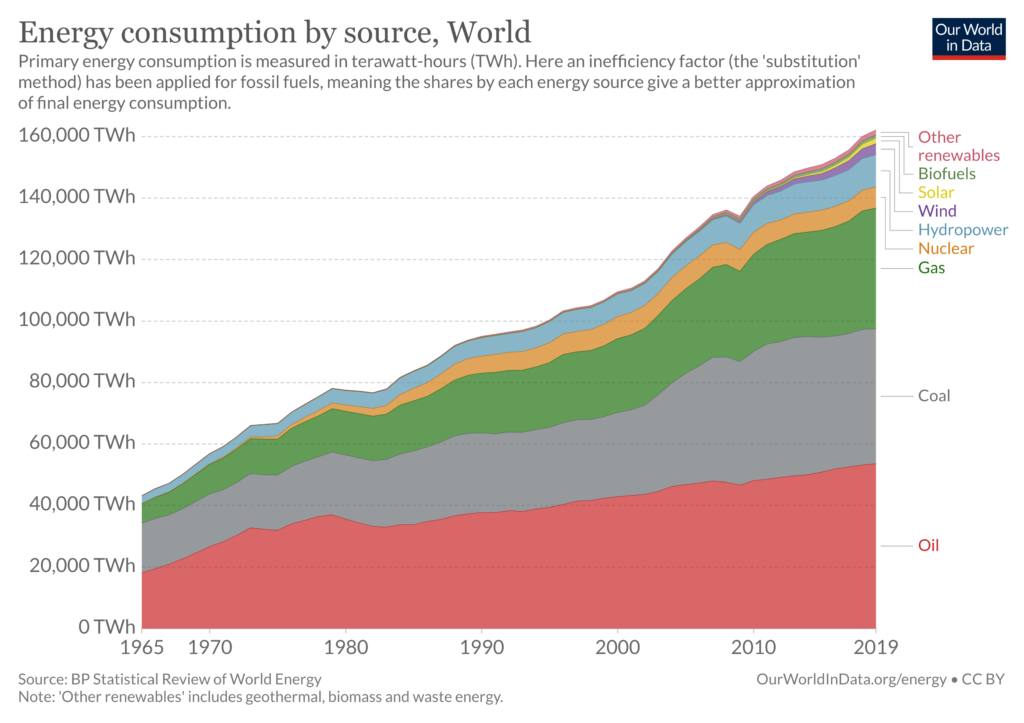
It is important thing to understand the world continues to consume more and more energy. 2009 was an exception to that rule and 2020 will be as well but the long term trends over the past 10 years and going back as far as I have data is that energy consumption keeps going up. Oil and gas consumption keeps going up as well on an absolute basis.
But the lockdown induced economic slowdown of 2020 will not last forever. Eventually the world will learn to live with the virus and the demand for energy will continue the long term trend of growth.
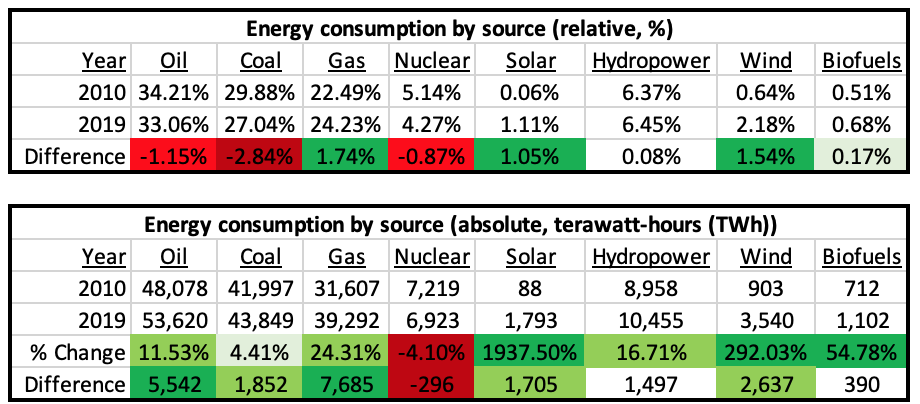
So what technology will be used to meet that demand? The trend has been an increase in energy coming from solar and wind. But they remain niche players on the global scene. As of 2019 Solar accounts for 1.11% of global energy consumption and wind accounts for 2.18%. These small industries have indeed been growing dramatically. The amount of terawatt-hours (TWh) of energy provided by solar went up 1,937.5% and wind went up by 292%.
On an absolute basis since 2010 the largest source of growth has actually been natural gas. Gas also had the largest increase on a relative basis, growing from 22.49% of energy consumption to 24.23%. However, coal and oil still remain the largest sources of energy and while they are shrinking on a relative basis they are both still growing on an absolute basis.
Date Source: https://ourworldindata.org/grapher/energy-consumption-by-source-and-region?stackMode=absolute&time=earliest..latest
The biggest loser since 2010 has actually been nuclear power. Nuclear has declined on both an absolute and relative basis. Nuclear provided 5.14% of global energy as of 2010 and has dropped down to 4.27%. On an absolute basis it has dropped from providing 7,219 TWh of energy and as of 2019 is down to 6,923 TWh. But even though nuclear energy consumption is declining, nuclear still provides more energy than solar and wind combined.
I think these trends will continue over the next 10 years. Solar and wind will continue to grow on a relative and absolute basis. But I think the relative growth they pick up will largely be from coal and perhaps in small part from nuclear unless the attitude towards nuclear technology changes. I believe natural gas will continue to grow on a relative and absolute basis. I further believe oil will continue to increase on an absolute basis but may stay relatively flat to downward on a relative basis. Coal will continue to decline on a relative basis and might even start to decline on an absolute basis as well.
Wind and solar are definitely in more of a growth mode, as you can see from those huge numbers, than the oil industry. But gas is also in growth mode. I do like alternative energy companies like Next Era Energy (NEE). While NEE is in the wind and solar space they also provide power using natural gas and nuclear. I’m looking for a buying opportunity and looking for value in the alternative energy sector as well.
But that doesn’t change the fact that oil and gas stocks are trading at steep discounts and oil and gas consumption is still in an uptrend. As billion hypocrite Warren Buffet once said be “fearful when others are greedy, and greedy when others are fearful.”
There is a lot of fear in the oil and gas industry so it might be time to be greedy.
The COVID-19 pandemic is a great tragedy and an unprecedented event in modern history. In the midst of countless negatives–one positive is this market selloff presents a buying opportunity.
As someone who has been overweight cash over the past few years I’ve been looking a selloff like this to be able to increase my exposure to the markets.
I can’t predict when the market will bottom or I would just buy in then. So I want to go over three strategies one could use to enter this market.
COVID-19 case Plateau
It is possible that when the number of active COVID-19 cases plateau that will also be around the time the market bottoms out.
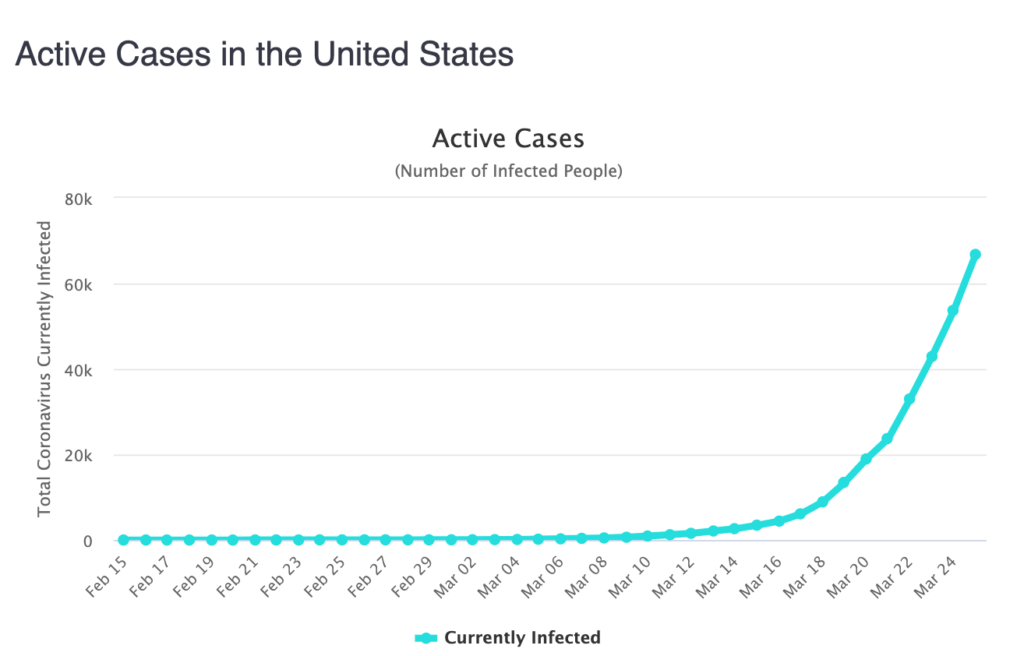
Active Cases in the US continue to climb
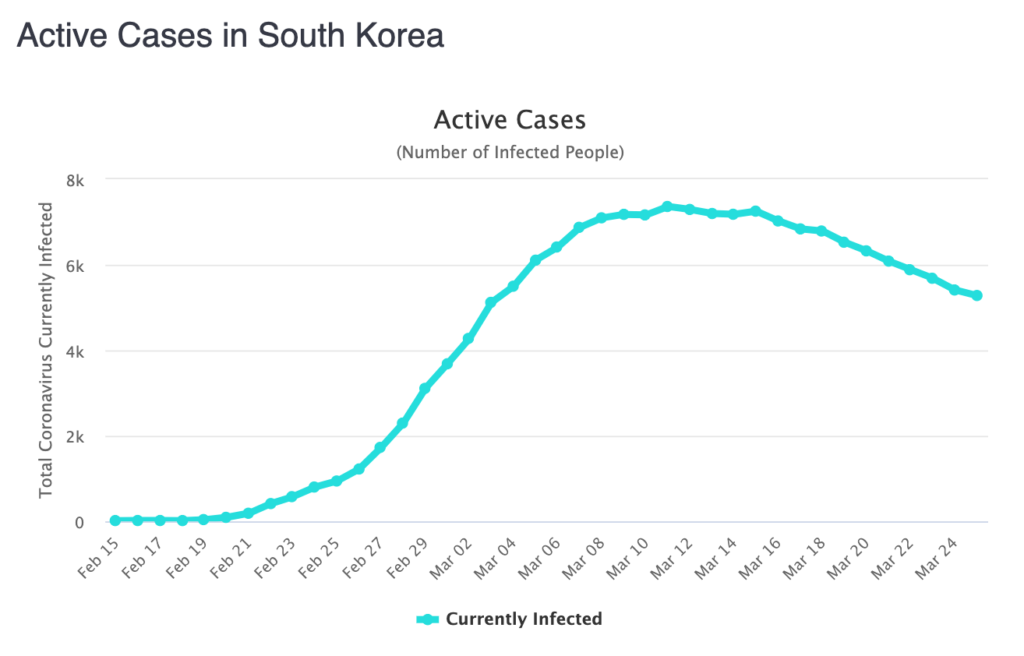
As of now the active cases in the US have continued to climb. At some point this will plateau, as it already has in places like South Korea.
Active Cases in South Korea Plateaued in mid-March
Modified Dollar Cost Averaging
This method attempts to capture market exposure at given price levels.
To do this, first determine how much you’re planning on investing. Then break than into a series of price levels. For example, if you’re planning on investing $3,000 at three different price levels, you’d be investing $1,000 per price level.
Price levels could be something like the % fall from the prior peaks drop. So when the market falls 30% from peak, you invest $1,000, when it falls 40%, another $1,000 and if it falls 50% the remaining $1,000.
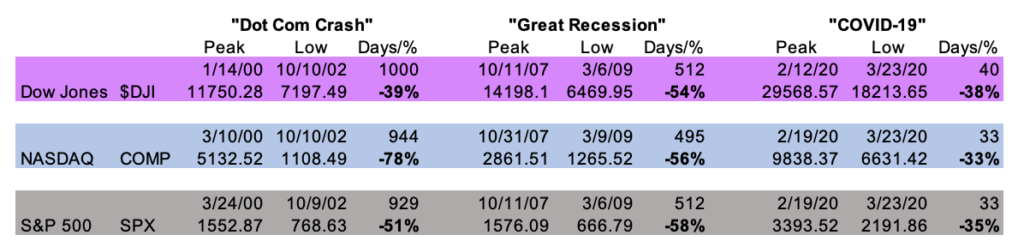
For example, the S&P 500 peaked at 3393 on 19 February. So $1,00 would be invested at the 30% drop level of 2375, a 40% drop would mean buying in at 2036, 50% would be 1696.
The downside to this is that the market might never fall 40% or 50%. If this happens one wouldn’t buy into the market at these levels and money would be left uninvested. It could also of course fall more, in which case one would have bought in at a higher level.
Looking at the previous bear markets of the past 2 decades, the bottom of markets is not made after just a 35% drop in 33 days.
Given that the number of COVID-19 cases in the US continues to climb I don’t believe the market has bottomed yet. The market has rallied about 14% off of the 23 March lows, but I believe the market will give up these gains and make a new low.
Of course I can’t know for sure.
Good Old Dollar Cost Averaging
This is probably the simplest and most basic method. This is buying a set dollar amount of shares on a set schedule. Such as $100 on the first of each month. When prices are lower, more shares will be purchased and when prices are higher, fewer shares will naturally be purchased.
The downside to this method is that if one has any reasonable belief that the market will fall more, then one is buying in at a higher price than is necessary.
Despite the rally over the past few days, major US indices like the S&P 500 are still down some 23% from the 19 February high.
Of course it’s impossible to know with certainty.
COVID-19 Selloff Buying Opportunity
Gold has been a decent hedge thus far. Gold is up 3% since the 19 February high compared to the S&P 500 which is currently down over 27%.
In the 2000 dot com crash markets didn’t bottom for for nearly two and half years. The 2007-2008 great recession market drop took about 500 days. We are less than 2 months into this crash.
We are certainly living in interesting times. While this has been a sharp and violent selloff, it presents a buying opportunity, if not now at some point over the next few months or years. I personally think the markets will fall lower, perhaps to the 40-50% level before beginning to climb again.
If you have ever had a stock broker chances are it will soon be Charles Schwab.
Back when I traded more actively I tried different brokers. I had a Scottrade account a Thinkorswim account and I also had a Evertrade account. I never singed up for a Charles Schwab or a TIAA account but I now (or perhaps soon will) have both. TIAA bought Evertrade and Chuck Schwab is in talks to buy TDAmeritrade.
Of course there will doubtlessly be some regulatory hurdles in place to ensure the acquisition won’t go through unless the right palms are greased.
Brokerage Gobbling
There has been a lot of consolidation in the brokerage industry over the years with one gobbling up another. Thinkorswim and Scottrade were both gobbled up by TDAmeritrade (which is an amalgamation of other acquired brokers like TD Waterhouse, Ameriprise, Fiserv and others).
Well there is always a bigger fish and now Charles Schwab is in talks to buy TDAmeritrade.
It isn’t clear how and even if consumers will benefit from all of this consolidation. While TDAmeritrade, Schwab and others recently announced commission free trading, it seems as though once a lot of the competition is eliminated the remaining 3-4 brokers will have more power to charge traders fees with few alternatives.
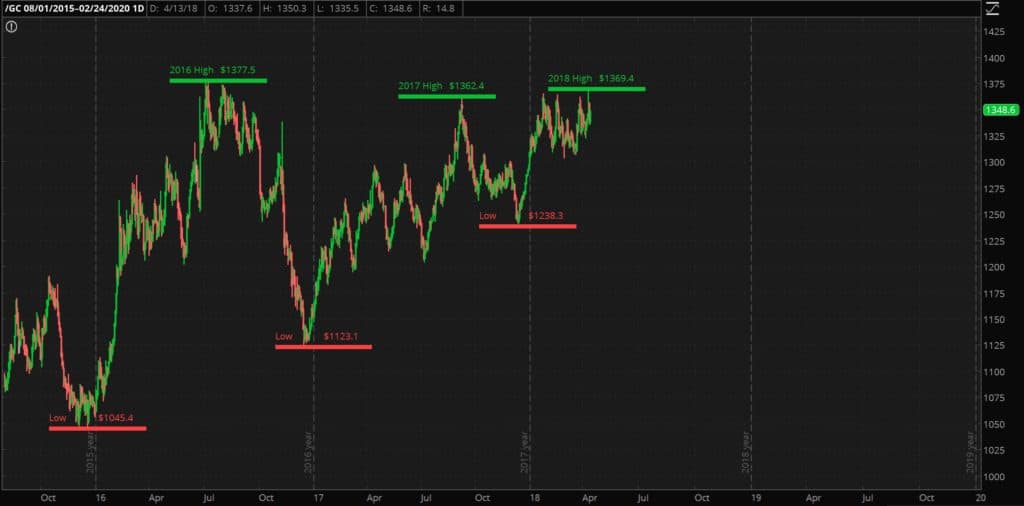
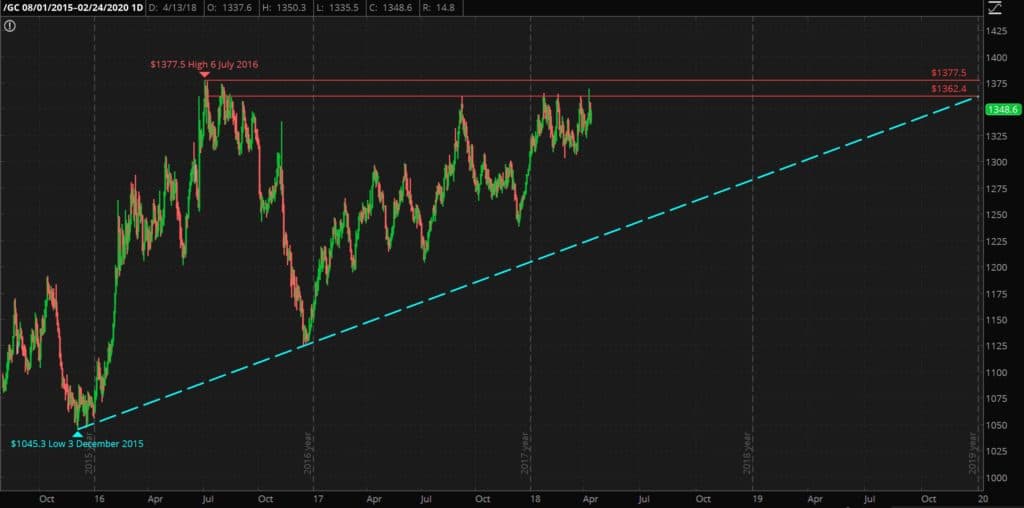
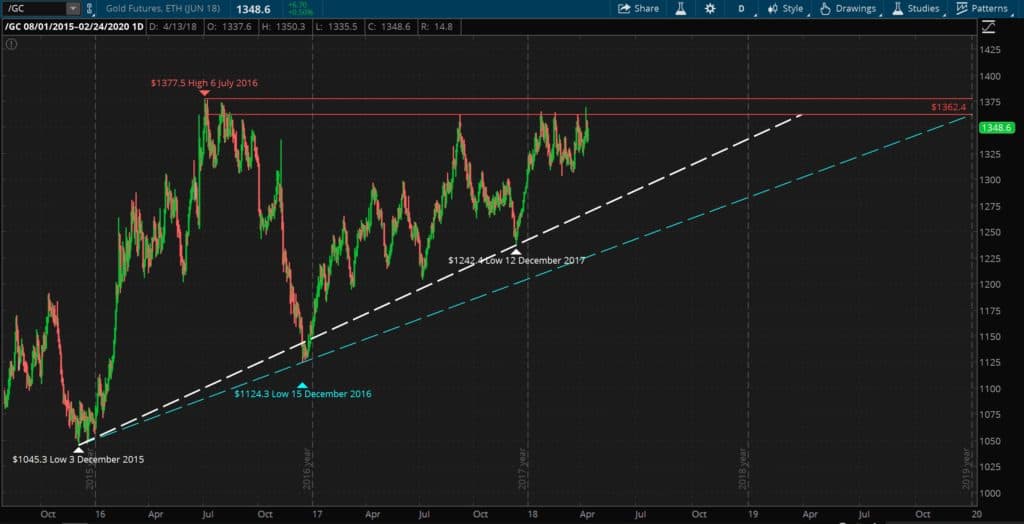
Gold has been steadily rising in an ascending triangle trading pattern since December of 2015. It’s my belief that gold bottomed in December of 2015 at $1045.4 per ounce. I don’t believe that gold will ever trade below $1045.4 again.
The highs being around the same level and then falling combined with progressively higher lows is what leads me to describe the last three years of gold price moments as an ascending triangle.
The high since gold bottomed in 2015 is $1,377.5 which occurred on 6 July of 2016. In the time between then and now gold has failed to match this high or make a new one. The price of gold has come within $20 on five separate trading days–three of which were in 2018 and one of those breakout attempts was last week.
Gold has been trending upwards in an ascending triangle. The blue dashed line is what I’m calling the December 2015-December 2016 support trendline
Fundamentals for What to Buy and Charting for When
Charting is more of an art than a science and I don’t think it works well in isolation. The fundamentals of an investment need to be in place to determine what to invest in and charting may provide some insight into when an investment will move in a given direction.
Now commodities don’t have balance sheets or cashflow so the fundamentals are based on supply and demand.
The supply of gold, while growing, is fairly static, I anticipate the demand to increase substantially given my view that stocks and bonds are in a bubble and that the US Federal Reserve will step in with low interest rates and QE to reflate the bubble, as they did after both the 2000 “dot-com” crash and the 2008-2009 crisis which will eventually destroy the dollar.
It is also important to note that while the above ground supply of gold is growing, the supply of gold in the west is declining at least relative to China and India. The supply of gold might even be declining in the west on an absolute basis although I don’t know that for sure.
Even without a dollar crisis I think gold will still trend upwards over the years and it could go up several hundred dollars even without a dollar crisis simply based on technicals and trading.
Timing, however, is very challenging and it’s not a skill in which I am particularly adroit.
So I buy and hold and dollar cost average. For example if gold bounced off the lower leg of the triangle and I was under-allocated in gold I would consider buying more. At this time I already own too much gold so I haven’t been adding significantly to my holdings.
Despite gold continuing in the ascending triangle there have been some interesting price phenomena of late that merit comment.
Intraday Gold High of $1369 on 11 April
Gold hasn’t reached $1369 since August of 2016. Admittedly gold was not able hold that level last week and closed at $1356. This is still a large spike upwards. Because the fundamentals of gold are so strong I think that one of these days gold will make a new multi-year high and perhaps even hold it if it can confirm the breakout with a $50-100 move above $1377. At that point $1377 would very likely flip and represent a support level.
The $1362-$1377 has been the range of resistance for the past 2.5 years but I don’t think it will hold forever.
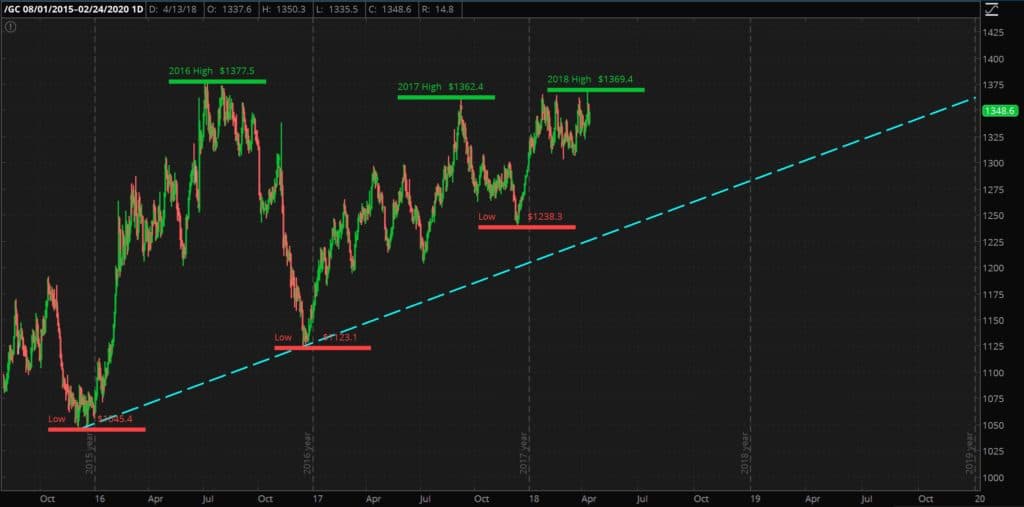
Lows are not reaching the Longer Term Trendline
The lows have not fully dropped down to the trendline drawn from the 3 December 2015 low of $1045 to the next highest low (after a high) which was made on $1124 on 15 December 2016.
The lowest gold traded at between the 2017 and 2018 highs was $1238, and it did not reach the December 2015-December 2016 dashed blue support trendline
So while gold hasn’t been able to make it back to the 2016 muti-year high (although it has gotten within $20 five times) the lows keep getting higher.
One interpretation is that gold isn’t actually in an ascending triangle and that the December 2015-December 2016 trendline isn’t useful.
Another way to look at this price action is that gold is in an ascending triangle and the fact that the lows are getting shallower is a bullish trend.
A third is that this rally off of the 15 December 2016 low has been slower and less strong and gold will go down to hit the trendline, and may even break through, which would admittedly be bearish. It’s true that the move up nearly 32% from $1045 to $1377 only took about 6 months. It took almost 8 months to go up 21% from $1124 up to $1362.
This is where charting becomes more of an art than a science.
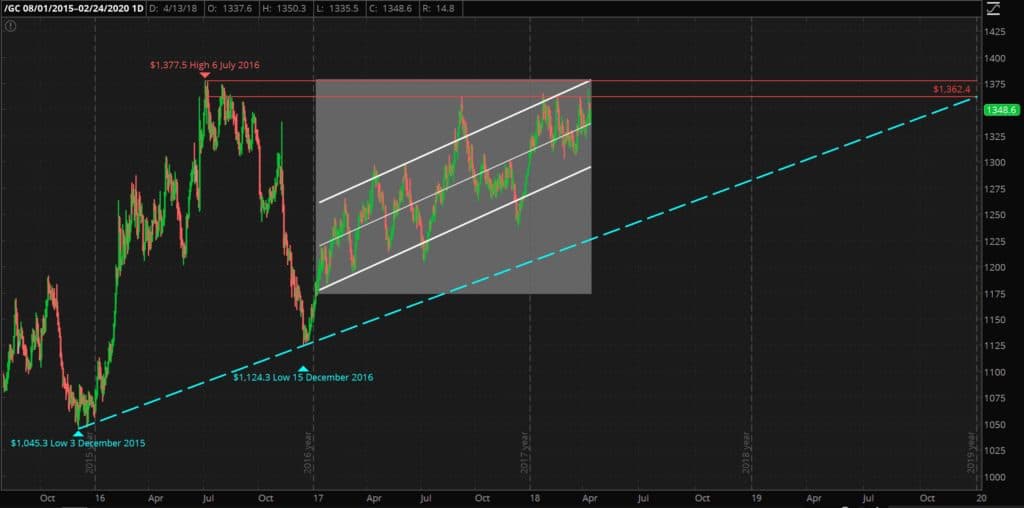
Compression of Gold’s Trading Range
The trading range of gold is compressed, even more-so than I would expect for an ascending triangle. Again, the highs haven’t been quite as high, but the lows are much higher as well. With a few outliers gold has been trading in a fairly narrow, upward range since the start of 2017.
With just a few outliers gold has traded in a fairly narrow range since the beginning of 2017
As I’ve said above the lows have not fully retraced the December 2015-December 2016 trendline. Yet another interpretation of this is that gold is in a very weak and slow rally. That the highs in 2017 and 2018 don’t count because they didn’t make it fully to $1377 and we’ll retrace the December 2015-December 2016 support trendline.
However I don’t think this is the case when you factor in market sentiment.
Gold Climbing a Wall of Worry
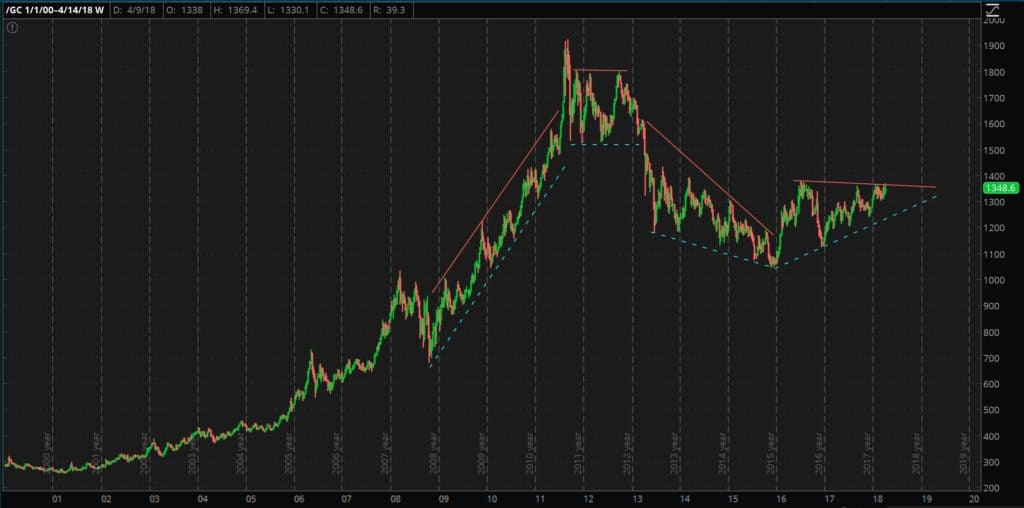
While gold has been trending up since the turn of the century, it had been a losing investment for many years in the wake of the all time highs that were made in September of 2011 in the wake of the 2008-2009 financial crisis. Gold was in a bear market for 3 years in a row from 2013 to 2015. Except for a few months, anyone who bought in 2011 or 2012 and held through to today is still underwater.
Gold has been a winner since the turn of the century
The narrative touted by Barrack Obama and now Donald Trump has been that everything is great and everything is improving. Sitting presidents always talk up the economy while they are in office because they want to get re-elected or if in their second term ensure they have a positive legacy.
Obama and Trump (at least until February 2018) have simply been after to refer to a chart of the S&P 500 as proof the economy is doing great.
So, most investors think they have no reason to own gold, since everything is great, and they don’t want to miss out on the stock market, which has been going up quite a bit until recently.
At the same time, 3 years of a gold bear market has shaken out the weak hands. There aren’t very many people who still own gold at this point who are going to sell now. If they held onto their gold as it fell from $1900 down to $1045 I don’t see why they would sell at $1150, $1250, or $1350.
So while there aren’t enough buyers stepping in to bid gold up over the 2016 high there also aren’t enough sellers for gold to drop significantly. That explains why gold can’t make new highs and why the lows continue to rise.
That is how I interpret the gold price chart.
If I’m right this also means is that when sentiment does change, when more people realize that stocks aren’t going to keep going up and that the economy isn’t great, they will move towards gold, but there won’t be many sellers, at least not at these prices. I could easily see gold going up $300 to $1600-1700 just from a technical perspective.
I do think Gold trading up to the $2000-$3000 would require a full on dollar crisis.
I don’t know when such a dollar crisis will take place. In my opinion given the debt, the lack of manufacturing, and the increase the growth the debt combined with rising interest rates that will increase the amount the US has to pay in interest on the debt are all fantastic reasons for a currency crisis to have already occurred.
Gold Market Ascending Triangle Timing
If gold is in an ascending triangle, as I believe it is, gold will break out of this pattern up or down within the next two years. Perhaps as soon as early 2019 depending on how you draw the support line. In either case I would want to see a strong move $50-100 above the $1377 resistance level to confirm trend was bullish or $50-100 below the support level as confirmation the trend was bearish.
While in the minority as gold bull I’m certainly not the only person with these views. Peter Schiff talked about the gold market trading range narrowing in a recent podcast (about 17 minutes in) and a 1 March article this year from Commodity Trading Mantra draws conclusions similar to my own.
However, today I’d like to write about why I like cryptocurrencies (and blockchain technology). I don’t see these views as contradictory, simply pragmatic.
If you aren’t already familiar with terms like blockchain, cryptocurrency or Bitcoin check out this explanation: What is Bitcoin?
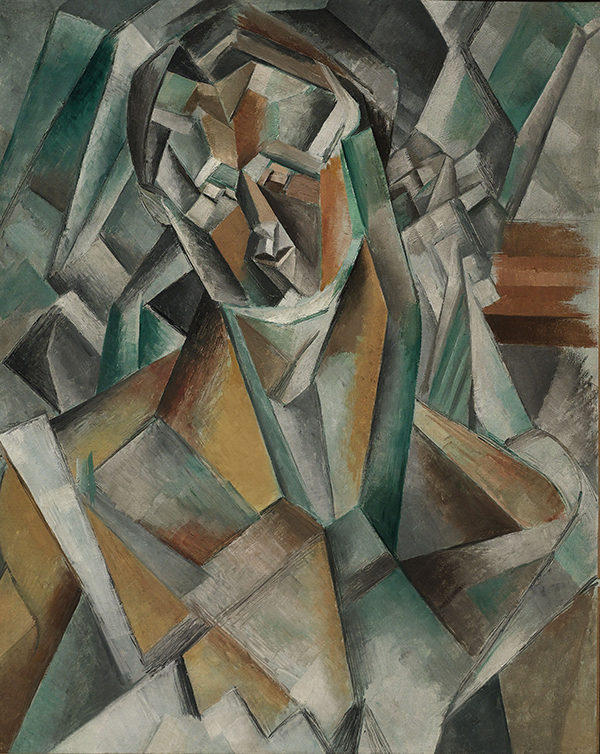
Let me give you an example to illustrate why it doesn’t really matter if there are things I dislike about cryptocurrencies. If you know a lot about art this won’t work. Lets say I created the following piece of artwork. Say it’s something I painted when I was in seventh grade.
I try to sell it. How much do you think it would go for?
I’m guessing somewhere between nothing and a few bucks. Personally I don’t think it is very good. I don’t like it that much. The paint and canvas could be purchased for a few dollars but they might be worth more unused.
But guess what, it’s actually a Pablo Picasso painting called “Femme Assise” and someone paid $63.7 Million for it in 2016.
I don’t particularly care for this piece of art but people are willing to spend millions for it. So If I knew a lot about art and spotted an original Picasso at a garage sale for $20 I would buy it knowing I could sell it to someone else for much higher.
Just because I don’t particularly like much of Picasso’s artwork doesn’t mean it isn’t highly valued by other people. Just because I think there are fundamental flaws with cryptocurrencies that prevent it from being a good long term store of value doesn’t mean they won’t rise in price–at least in the short to medium term.
Whenever money is pouring into a sector or industry that is an opportunity for profit. And so I view cryptocurrencies as a speculation rather than an investment. But given all of that there are several things I like about cryptocurrencies.
1) Cryptocurrencies are great for Speculation and Trading
On 28 April 2013 the market cap of all cryptocurrencies was $1.59 billion. It’s currently nearly $28 billion.
That is a tremendous inflow of money in a period of just four years. Cryptocurrencies are a rapidly growing market and it’s easy to pick a winner when everything is going up, wether it is stocks or cryptocurrencies.
The price of cryptocurrencies also tends to fluctuate dramatically and that sort of volatility is great for trading.
2) Cryptocurrencies aren’t Controlled by the Government
I’m sure some people go into government because they want to do good and make a positive change in the world.
However, on the whole government, at least in the United States, seems to mainly work to perpetuate itself. One way the US government has been able to stay in power is by going into debt and printing money.
While I think most cryptocurrencies are fairly centrally controlled the people in control of these cryptocurrencies have motivation to work for the long term good of the currency and technology since there are hundreds of other cryptocurrencies out there that people could easily adopt instead.
I think the inspiration and popularity of cryptocurrencies is at least in part due to this reckless government spending which is itself inflation and the cause of price inflation.
Many (but not all) of the cryptocurrencies including the largest, Bitcoin, are designed to be deflationary in nature.
3) Potential Widespread Adoption
A cryptocurrency or blockchain technology could be widely adopted as a replacement for one or more parts of the legacy financial system.
A Replacement for Dollars or Euros or Yen…Etc
While billions of dollars have flown into cryptocurrencies over the past several years there still isn’t widespread adoption by consumers. You don’t go into the local quick mart to pay for gasoline with DASH or Bitcoin. Amazon.com doesn’t accept Monero or Zcash as payment.
Spending dollars online and in the brick and mortal world using technology like Paypal or simply a credit card works great. The technology for spending fiat currency is mature and works fine in most use cases.
An Outside Catalyst
For some reason the average consumer in America (and perhaps people around the world too) doesn’t really about inflation, at least not directly. They care their rent goes up each year and things are getting more expensive, but they don’t think about the cause of rising prices (other than unfairly blaming “greedy business owners”).
Right now inflation is “only” 2-8% per year. Even though that represents a tremendous loss of purchasing power over time it is low enough that people aren’t really concerned about it. As long as price inflation is relatively low and stable I think people will continue to use government issued fiat currency.
But if inflation really started to take off (as I think it will some day) I anticipate the appeal and adoption of cryptocurrencies would take off as well and with it the price.
Weakest Elements of the Legacy Financial System
However international wire transfers are rather slow and somewhat expensive. And I’m not aware of an online cash-like payment system that existed before Bitcoin. So international settlements and online cash-like transactions are two areas within the legacy financial system that leave room for cryptocurrencies and blockchain technology to step in as a superior alternative.
Blockchain technology like Ripple, which has been sponsored by numerous large banks around the world, could very well replace certain elements of the international financial system.
Cryptocurrencies like Zcash and DASH, which are better than Bitcoin when it comes to speed and privacy, could very well gain large marketshare as a way to make cashlike transactions online.
4) Blockchain technology
In addition international settlements there are a variety of other applications for which Blockchain technology, one of the fundamental technologies behind cryptocurrencies, could be transformative. Areas like stock ownership, smart contracts, digital voting, and cloud storage could be revolutionized by blockchain and cryptocurrencies.
Cryptocurrencies and Blockchain Technology
I don’t see these technologies going anywhere. They could very well revolutionize many sectors in the financial world.
For all the reasons I’ve listed before, I don’t know that buying into a cryptocurrency is going to be a good long term store of value.
However, the technology itself is powerful and there is the potential for profit if one makes some daring (and correct) speculations.
This website uses cookies to improve your experience. We'll assume you're ok with this, but you can opt-out if you wish.AcceptRejectRead More
Cookie Policy
Privacy Overview
This website uses cookies to improve your experience while you navigate through the website. Out of these, the cookies that are categorized as necessary are stored on your browser as they are essential for the working of basic functionalities of the website. We also use third-party cookies that help us analyze and understand how you use this website. These cookies will be stored in your browser only with your consent. You also have the option to opt-out of these cookies. But opting out of some of these cookies may affect your browsing experience.
Necessary cookies are absolutely essential for the website to function properly. This category only includes cookies that ensures basic functionalities and security features of the website. These cookies do not store any personal information.
Any cookies that may not be particularly necessary for the website to function and is used specifically to collect user personal data via analytics, ads, other embedded contents are termed as non-necessary cookies. It is mandatory to procure user consent prior to running these cookies on your website.