by John | Mar 13, 2018 | Stocks I Like, The Stock Market, Value Investing
It’s been a year since my last value stock pick. I haven’t been buying stock and have been focused on building up a war chest I can use to buy stocks and other assets at a discount when the US economy faces it’s next crash.
I don’t know when the next stock market crash will take place nor have I failed to notice that stocks are up some 300% since the lows of the 2008 financial crisis.
So I maintain some exposure to stocks even though I believe the stock market a whole is overvalued.
I believe value stocks will continue to outperform in the long term.
I prefer value stocks that pay a dividend yield. My March 2018 pick is a cash flow machine.
March Value Stock Pick
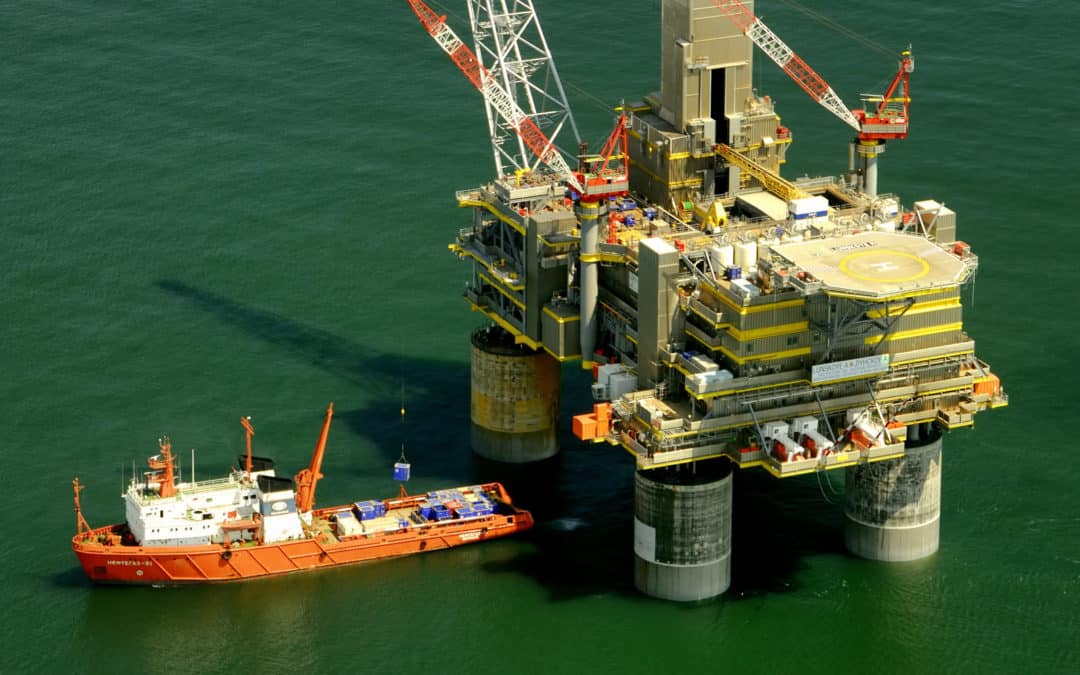
Royal Dutch Shell (RDSb London Stock Exchange, RDS.B NYSE)
Remember here are the metrics I look at:
1) Enterprise Value to Market Capitalization (EV/Market Cap)
2) Enterprise Value to Free Cash Flow (EV/FCF)
3) Enterprise Value to Earnings Before Interest and Tax (EV/EBIT)
4) Enterprise Value to Owners’ Cash Profits (OCP)
5) Operating Margin
6) Dividend Yield
7) Return on Equity (ROE)
Energy production is very capital intensive so I’ve decided to compare Royal Dutch Shell (RDSb) to similar companies: Exxon Mobil (XOM), Total (TOT), and Chevron (CVX).
Data is from Morningstar as of 13 March 2018 (with the exception of EV/Owner’s Cash Profits) which is from yCharts as of 16 March 2018.
So how does RDS stack up?
1) EV/Market Cap
I like to see an EV/Market Cap below 1. Of these four energy companies none meets this criteria and RDSb is actually the highest. Total is the lowest just edging out Exxon Mobil by what amounts to a rounding error.
RDSb – 1.242
XOM – 1.134
TOT – 1.129
CVX – 1.154
Winner: Total (TOT)
2) Enterprise Value to Free Cash Flow (EV/FCF)
EV/FCF is where RDSb really shines compared to it’s peers. EV/FCF is in my view a more accurate measure than Price to Earnings (PE). The lower the number the better.
RDSb – 19.55
XOM – 24.42
TOT – 28.99
CVX – 36.15
Winner: Royal Dutch Shell (RDSb)
3) Enterprise Value to Earnings Before Interest and Tax (EV/EBIT)
Another metric where lower is better.
RDSb – 18.31
XOM – 18.57
TOT – 14.68
CVX – 26.98
Winner: Total (TOT)
4) Enterprise Value to Owners’ Cash Profits (OCP)
16 March 2018 Update:
EV to Owners’ Cash Profits is another metric that I believe is more accurate than price to earnings.
EV / Owner’s Cash Profits / EV/Owner’s Cash Profits
RDSb – 331.89 / 8.875 / 37.4
XOM – 357.85 / 9.753 / 36.69
TOT – 170.82 / 5.36 / 31.88
CVX – 254.97 / 0.758 / 336.41
Winner: Total (TOT)
Source: yCharts
5) Operating Margin %
All else equal a higher operating margin percent is better than a lower one. Exxon Mobil takes the cake in this metric.
RDSb – 6.59%
XOM – 19.71%
TOT – 4.91%
CVX – 6.72%
Winner: Exxon Mobil (XOM)
6) Dividend Yield
Stocks in the oil and gas industry typically pay good dividends. Shell pays the highest of these four:
RDSb – 5.86%
XOM – 4.09%
TOT – 4.84%
CVX – 3.73%
Winner: Royal Dutch Shell (RDSb)
7) Return on Equity (ROE)
The ROE of Shell lags it’s peers. I typically look for an ROE over 8%.
(TTM) / (5 Year)
RDSb – 5.61% / 6.48%
XOM – 11.10% / 13.54%
TOT – 7.85% / 8.19%
CVX – 6.26% / 8.31%
Winner: Exxon Mobil (XOM)
Reasons to be Cautious
Shell has a payout ratio of 144.6%. That means that the dividend might be unsustainable.
However, Shell’s payout ratio has been below 100% from 2008 up through 2014 and I think that the payout ratio will drop to a sustainable level in the next year or two.
The return on equity for shell has also been lower than I’d like but they are also in stronger financial shape (based on the current ratio and quick ratio) than ROE king Exxon.
Another Valuation Metric
One way to calculate a margin of safety is by determining what multiple of the EBIT the stock is trading at. I could write an entire article on how this is calculated (shout out to Jason Rivera who I learned this technique from).
Basically I’m looking at (EBIT * 14) + Cash Equivalent / Shares
Using the number 14 in the equation might seem somewhat arbitrary but it isn’t. The reason I chose that is because if you plug in 13.5 you get the current share price of Shell. In other words Shell is trading at EBIT x 13.5 + Cash Equivalents.
Using this metric (using a multiple of 14) we find a “fair” share price of each of these four stocks would be as follows:
RDSb – $65.9
XOM – $64.1
TOT – $75.8
CVX – $72.7
And if we compare the actual share price to these values we get the following “margin of safety” for each stock:
(EBIT * 14 + Cash) / (Current Share Price) / (Margin of Safety)
RDSb – $65.9 / $63.59 / -3.49%
XOM – $64.1 / $74.53 / 16.27%
TOT – $75.8 / $57.66 / -23.91%
CVX – $72.7 / $116.46 / 60.12%
Winner: Total (TOT)
Using this technique we can see that Shell is trading at about a 3.5% discount to 14xEBIT + Cash. Exxon is trading at a 16.27% premium, Total is trading at a generous 23.91% discount and Chevron is overvalued by a large 60.12%.
Even though it is in a totally different industry, just for fun, I decided to compare this to Netflix (NFLX). NFLX is currently trading at $315.88 per share. At 14 times EBIT plus cash NFLX should be trading at $6.32 and at current prices it is trading at a a 4,900% premium.
I would venture to say that Netflix is overvalued.
Class A or Class B?
I used to own RDSa in a Roth IRA. The RDSa shares are subject to a 15% withholding to the Dutch government. Because of this RDSa trades at a discount to RDSb, which does not have this withholding.
At one point you could get around the 15% withholding through Shell’s scrip program (which they have discounted twice) and get a lower price and higher yield.
But given that the scrip program has been discontinued I choose to own RDSb. I prefer to own it on the London Stock Exchange but I do own it in US markets in a Roth IRA.
Shell is a great value
Shell is a great value and a cash flow machine with a strong dividend. Total is an excellent value as well although it has thin operating margins and has struggled to generate free cash flow with the same consistency as Shell and so for those reasons I prefer Shell.

by John | Feb 26, 2018 | Asset Allocation, Capital Appreciation, Economic Outlook, Geopolitical Risk Protection, Liquidity, Preservation of Purchasing Power, The Economy, The Stock Market, Wealth Protection
Over the past few weeks I’ve been writing about the faulty wiring in the United States economy that will eventually result in an Economic Conflagration.
The faulty wiring that will ultimately lead to this economic firestorm includes the fact that the real economy is weak, the economy is crushed by profligate debt and that stocks are overpriced and due for a significant crash.
One of the reasons why candidates such as Bernie Sanders and Donald Trump were popular in the last United States presidential primary and general election is because people know that the real economy is weak. They know how much debt they have and they want someone to make radical changes and do something about it.
Unfortunately government has never been particularly good at creating wealth or prosperity.
Some people might choose to rely on politicians to fix things. This website is not for those people. HowIGrowMyWealth.com is for people who want to take some common sense steps to grow and protect their wealth.
Given the faulty wiring the economy it is more important than ever to grow and protect one’s wealth. It might take a while but this faulty wiring will eventually result in a fire that will burn uncontrollably.
I realize this isn’t necessarily very cheery stuff but fear not! There is plenty of room for optimism.
I’m not a doomsday “prepper” or perma-bear and I’m sure that entrepreneurs, if free to do so, will rebuild the economy and usher in greater prosperity that will not be funneled to the politically connected.
I’m also cognizant that the stock market has gone up nearly 300% since the great recession, there hasn’t been hyperinflation in consumer prices and on the surface the crisis seems to have passed long ago. I don’t have a crystal ball and being right early sometimes looks like being wrong.
Despite the relative calm there is faulty wiring in the economy and sooner or later it will spark and ignite blaze that will, to quote Peter Schiff, “will make the financial crisis of 2008 look like a Sunday school picnic.”
The politicians, if they even realize that there are systemic problems in the economy, simply aren’t willing to endure the short term pain and inconvenience of ripping out the faulty wiring in order to fix the underlying problems. So they will continue to kick the can until the economic house burns down.
The bright side is that this will present an opportunity to rebuild the economy based on a strong foundation as opposed to what we have now, a phony economy based on debt, cheap money and consumption.
There will be winner and losers. I’m very optimistic about the future and I want to be counted amongst the winners.
So where am I putting my money?
My asset allocation falls into three main areas. Value stocks, gold and cash.
Value Stocks
Most people love buying things on sale and getting a great deal, expect when it comes to investing. When it comes to investing people want to buy expensive things and hope they go higher. Value investing takes that same common sense, buying things when they’re on sale and applies it to stocks and other asset classes.
The stock market as a whole is overvalued by a variety of metrics. But there are still good deals out there especially in non-US markets. I don’t doubt that value stocks will also go down in the event of a stock market crash but I think they will go down less and they will recover with more strength.
I could write entire articles on value stocks and I have. I’ve written about the value investing metrics I use when evaluating a stock and I also have my own value stock picks based on these metrics.
I share my value stock picks publicly. But I only share if I would buy them today or if I would hold or add to my positions with members of my free email newsletter. I will also let me email subscribers know when I buy or sell a stock first, before I publish that information to this website.
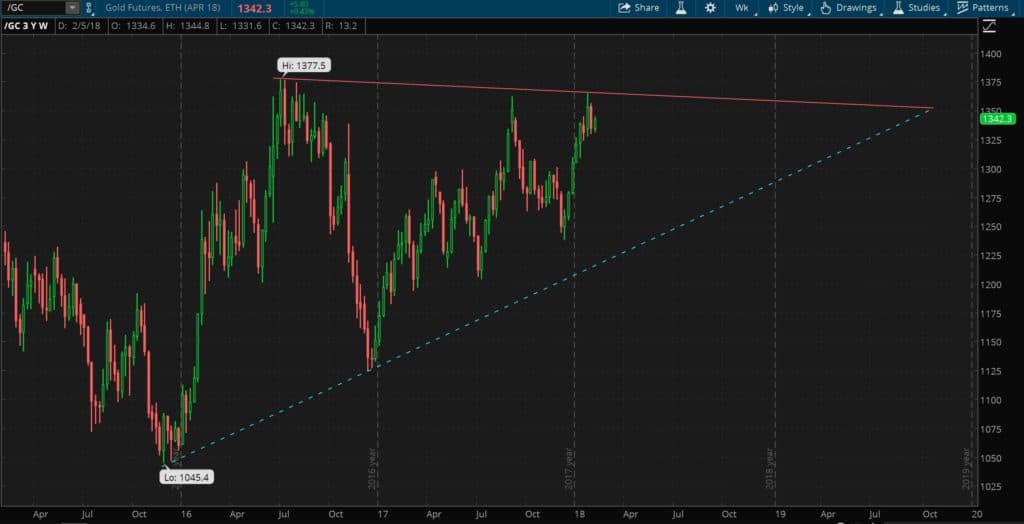
Gold
I don’t think you will get rich buying gold but it could prevent you from getting poor. Under relatively normal circumstances the demand for gold is fairly steady and the supply is fairly steady so for the most part the price of gold will rise with the level of inflation.
Gold is a way to save purchasing power. It’s a way to opt out of the financial system and wait for sanity to return.
If the dollar tanks loses it’s reserve currency status gold will still be valued.
I also think there has been significant effort to suppress the price of gold and depending on how much downward price manipulation there really has been, the price of gold could go up significantly from where it is right now.
If fiat currencies collapse that could very well induce a flight to the safe haven asset of gold that this influx of demand would be very bullish for gold.
Because of the absurd expansion in central bank balance sheets and artificially low interest rates I like gold presents a fantastic value at current prices.
What I write about gold applies to silver–another asset I think will do very well in a downturn. Silver has the added benefit of being an industrial metal that is more widely consumed.
Cash
Long term, like every other fiat currency, I think the dollar will go to zero. So why would I want to hold dollars?
First, I own a month or two of expenses in physical cash in a secure location in case there are capital controls. If there is a panic and people start withdrawing money from the banks the banks might in turn say, you can only withdraw $500 a week or something like that. Withdrawal limits could also be imposed if the US implements negative interest rates and people (very rationally) decide it is better to hold dollars in physical cash so they don’t have to pay interest to their bank for the privilege of loaning their money to the bank.
I reside in the United States and everything is priced in dollars so I need dollars to buy things. If I lived in the eurozone I would hold pounds or euros, if I lived in China I would hold Yuan. If I lived in the socialist paradise of Venezuela I would probably hold dollars (and try to get out).
Secondly, apart from physical cash I also hold dollars in a money market fund as a war chest. If stocks tank I expect there will be bargains to be had. I want to be buying stocks (if they are high quality free cashflow producing companies) when everyone is panicking and selling.
Now I fully expect the United States Federal Reserve to do what it has done in all other crises it has created–it will lower interest rates and buy assets to prop up the markets.
With interest rates already low once they cut rates to zero they will only be able to do things like Quantitative Easing and Negative rates. This is very bearish for the dollar and very bullish for gold.
But in the highly unlikely chance the US Federal Reserve does the right thing and lets the stock market collapse and lets the US government default on it’s debts this could be very bullish for the dollar. So holding some dollars is a hedge against deflation as well as a war chest to draw upon to buy undervalued stocks post crash.
What are some other possibilities?
While the bulk of my holdings are in cash, value stocks and precious metals I also dabble in some other alternative investments.
Cryptocurrencies
I’ve been a skeptic of cryptocurrencies for many years. I’ve also owned them for many years.
If there is a dollar crisis or collapse in the faith of central bankers then more people could turn to cryptocurrencies and could see it rise. Demand for cryptocurrencies could also rise for other reasons pushing the price upwards.
While I think blockchain technology is here to stay the value of any one specific cryptocurrency or token could very easily tank to nothing. Cryptocurrencies are very risky and 90% swings (both directions) happen.
You need to have an iron stomach but having between 1-5% of your liquid net work in cryptocurrencies isn’t the most outlandish idea in the world.
I would only speculate on cryptocurrencies with what you can afford to lose and I don’t considering buying cryptocurrencies investing in a technical sense since I am simply betting on the price going up.
I’ve shared with my readers my Group of Six cryptocurrencies that I’ve chosen to own and speculate on.
Options
Net I’ve actually lost money trading options. I traded options while unemployed and failed to remain dispassionate and objective. I was so focused on making money that I opened positions when the conditions were not ideal and took risks I should not have been taking.
I do believe if you are disciplined and follow the appropriate rules, you can do well trading options.
During a stock market crash volatility spikes and selling options could be a good strategy. When the VIX (a volatility index) spiked up in early February I sold a few options and those positions are doing well as volatility has dropped and the market has recovered. Markets don’t move straight up or down for very long so even if the February selloff portends drops to come, the market doesn’t drop as fast as people think in the midst of the drop.
Real Estate
Unlike all the other assets mentioned above I do not and never have owned any real estate.
Lots of people have made lots of money in real estate. I am working to learn more about this asset class and hope to own my own rental property at some point.
What I like about real estate is that it is easy to use leverage and the tax benefits are ridiculous. You can effectively pay no tax on investment property income and borrow a lot of the money you need to get started.
You of course need to know what you’re doing.
My goals for owning real estate involve owning a multi-family apartment building. The key for me is a cashflow positive property. I don’t have any interest in trying to buy and flip, although some people are very successful doing this. There are lots of ways to make money in real estate and I recommend biggerpockets.com to learn about them.
I think cashflow positive real estate will do okay in the event of a crash. If you’re in an area that has stable employment prospects those workers will always need a place to live and have the money to pay for it. Of course real estate won’t “always go up” and there are a lot of risks and headaches associated with managing property (if you don’t outsource property management).
This is part 5 of 5 of what I’ve decided to term The Economic Conflagration series where I discuss the faulty wiring pervasive the global economy:
Part 1: A Deadly Electrical Fire you Need to Know About
Part 2: The Real Economy is Weak
Part 3: Crushing Debt in the United States Limits Economic Growth
Part 4: Stocks are Overpriced and Due for a Significant Crash
Part 5: Where to Put Money when the Stock Market is Overheated
by John | Feb 11, 2018 | Economic Outlook, Geopolitical Risk Protection, The Stock Market, Wealth Protection
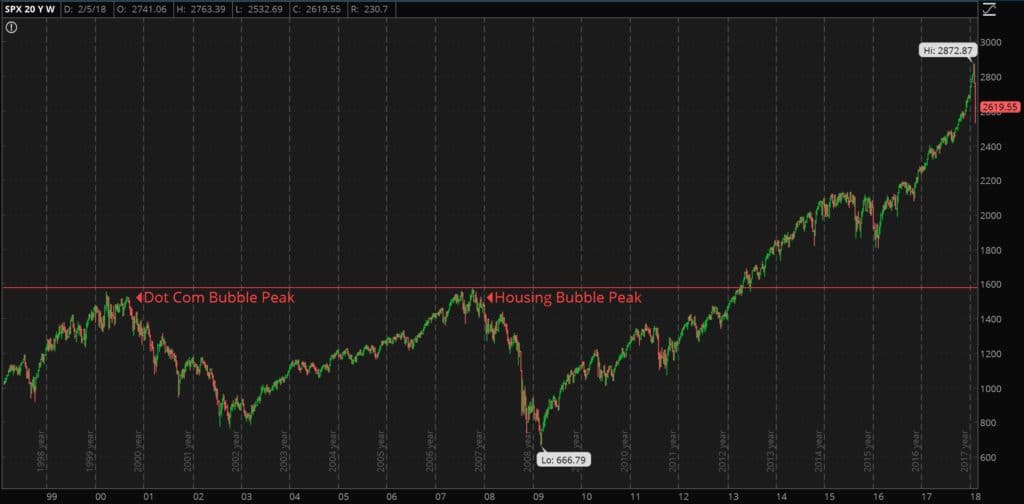
Despite the pullback over the past few trading days, the S&P 500 is still far beyond the highs during the dot-com bubble and subsequent bust as well as the housing bubble and subsequent great recession.
If the fundamentals supported the S&P 500 at these elevated prices it would be great but the fundamentals do not…these elevated stock prices are one of the faulty wirings running through the global economy.
Up until the last few trading days, using the Shiller PE ratio*, there has only been one time in the history of the S&P 500 when the Price to Earnings level was higher, and that is the peak of the dot-com bubble.
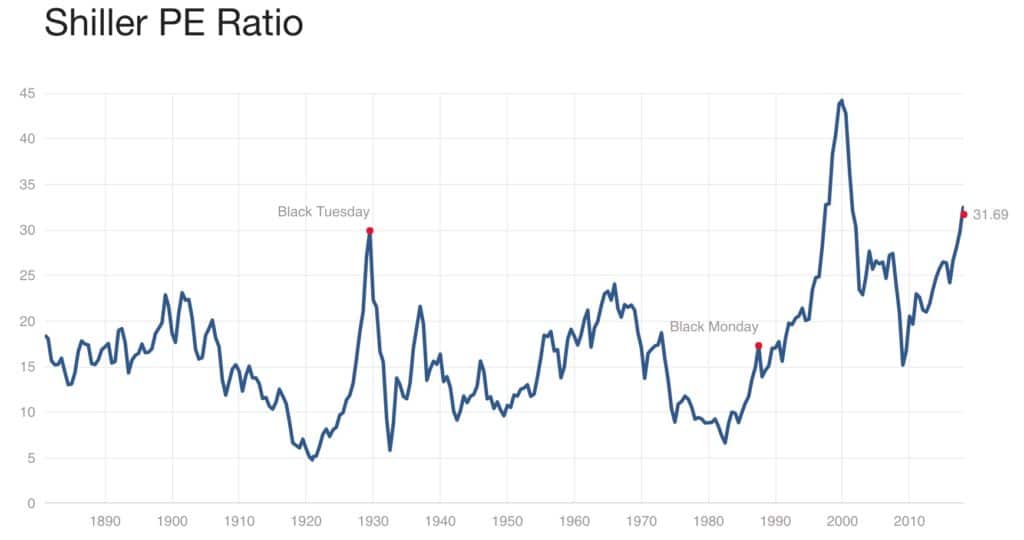
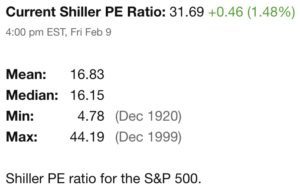 *Price earnings ratio is based on average inflation-adjusted earnings from the previous 10 years, known as the Cyclically Adjusted PE Ratio (CAPE Ratio), Shiller PE Ratio, or PE 10
Source: http://www.multpl.com/shiller-pe/
While imperfect (I tried in vain to find a Price to Free Cashflow chart for the S&P 500), the price to earnings ratio is essentially how much a stock (or in this case the S&P 500 index) costs relative to it’s earnings. A lower PE is better because it means you are paying less for a stream of income.
Price to book is another metric we can look at and the price to book ratio of the S&P 500 is at a level not seen since the 2008 financial crisis.
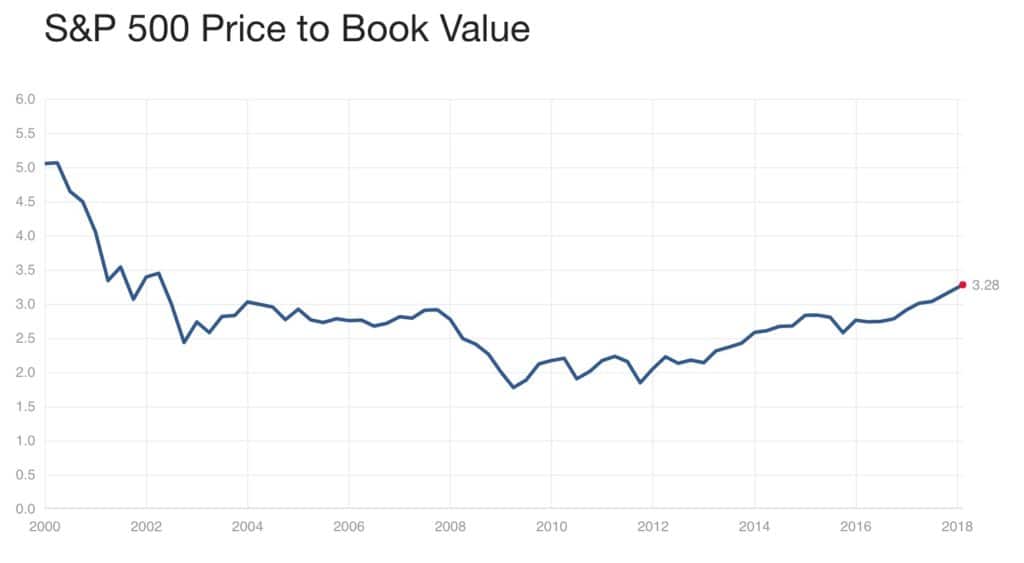
Source: http://www.multpl.com/s-p-500-price-to-book
Netflix: A Specific Example
I want to pick on Netflix as an example of an overvalued stock.
One of the most important metrics for evaluating a company is free cash flow. Earnings can be a little suspect because of accounting gimmicky but it is tough to hide free cash flow numbers. It’s one of my value investing metrics.
Netflix (NFLX) has not had positive free cash flow since twenty-thirteen. In 2016 the free cash flow was in excess of negative $1.5 billion and the trailing twelve month free cash flow amounts to over negative $2 billion.
Source: http://financials.morningstar.com/cash-flow/cf.html?t=NFLX®ion=usa&culture=en-US
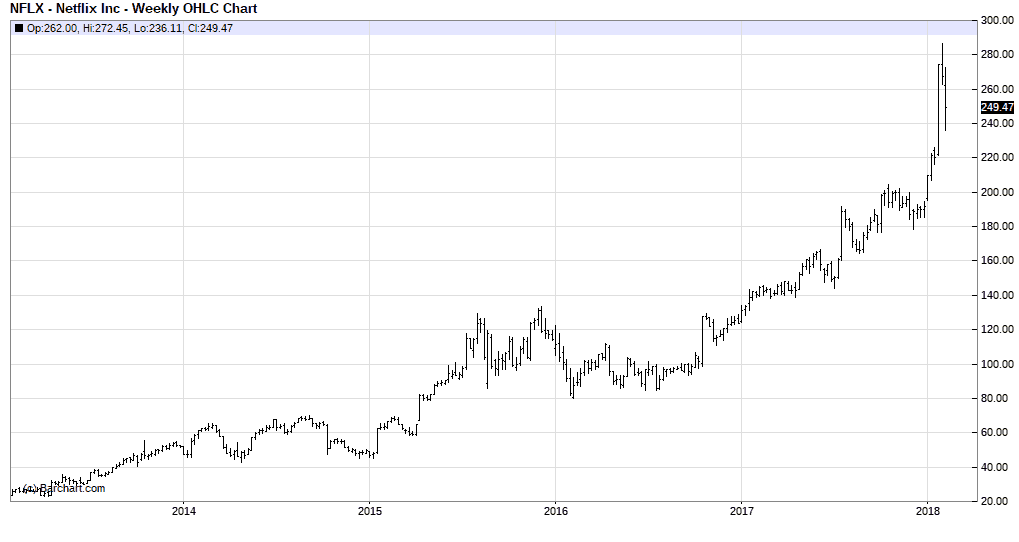
So they are bleeding money and yet as you can see from the chart above, apart from this last week Netflix stock continues to climb.
What is Causing the Stock Market to Rise?
The United States Federal Reserve has bought bonds to lower interest rates and has also bought other toxic assets (like mortgage backed securities “backed” by mortgages that had defaulted).
In the wake of the 2008 financial crisis the Federal Reserve balance sheet has swollen to over $4 trillion. The chart below shows the Fed’s balance sheet in millions of millions (aka trillion).
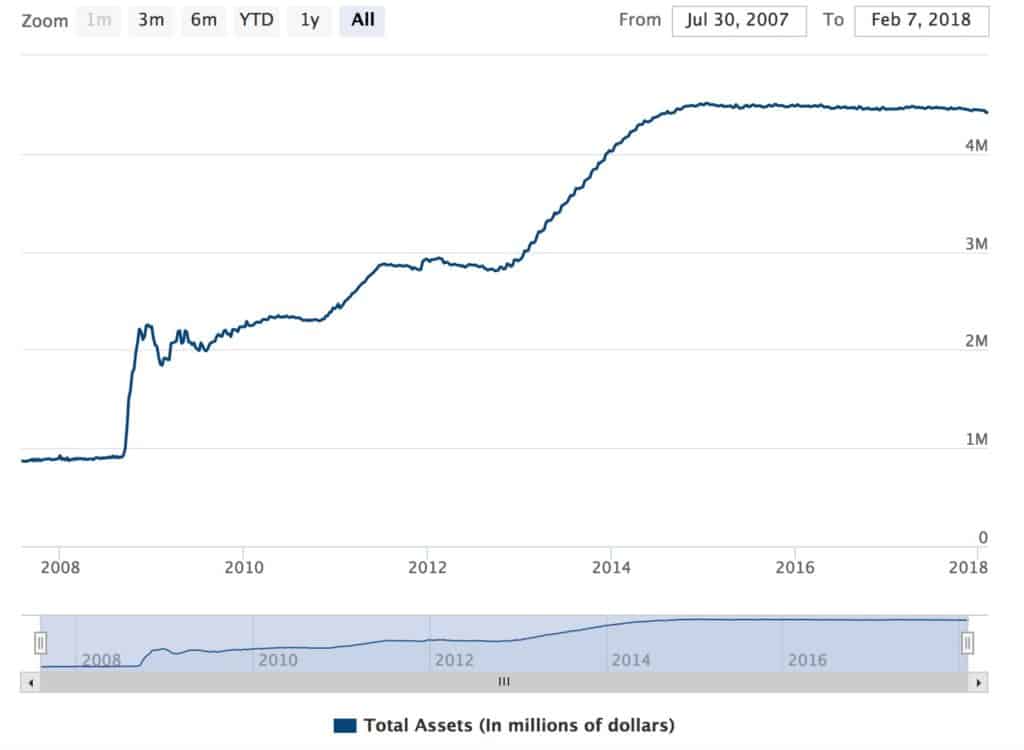
Source: https://www.federalreserve.gov/monetarypolicy/bst_recenttrends.htm
This has driven down bond yields and driven up bond prices.
This makes it cheaper to borrow money to buy stocks. It also forces income focused investors to forsake bonds (which have little to negative real yield) and instead pour money into dividend paying stocks.
Companies can also issue bonds at lower rates, and use the proceeds to buy back their own stock.
Source: https://www.wsj.com/articles/companies-stock-buybacks-help-buoy-the-market-1410823441
Source: https://www.reuters.com/investigates/special-report/usa-buybacks-cannibalized/
Source: https://www.wsj.com/articles/buybacks-pump-up-stock-rally-1468363826
The Stock Market is Overvalued
Stocks are overvalued and as bubbly as can be due to reckless US Federal Reserve monetary policy. Last Thursday the 8th the stock market closed in correction territory. It rallied back Friday.
I don’t know if this is the start of a larger selloff into a full on bear market or if this will be contained to a correction.
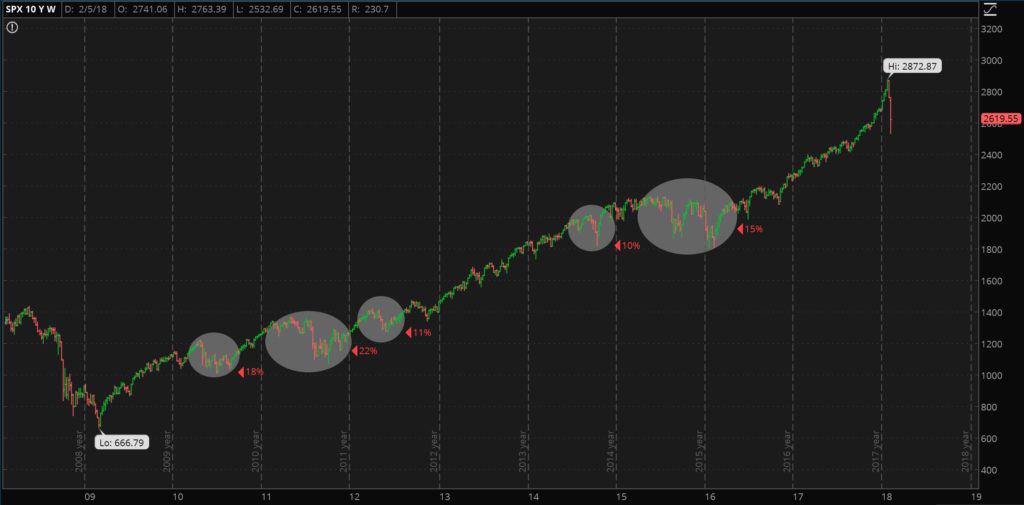
Since the lows of the 2008-2009 financial crisis there have been several corrections and even a 22% drop in 2011. Those were in an ultra accommodative monetary environment and not in a tightening cycle.
This probably *should* be the start of a bear market but the bulls and the Fed might be able to bid the market back up as they have several times before.
I don’t recommend trying to short the market or (if you own stocks) sell. If you know how to time the market I want to get advice from you because I don’t know how to time the markets.
I do know that stocks are overvalued and due for a correction. If the Fed does step in to prop up the markets it will be more negative news for the dollar. The Fed also doesn’t have much room to cut rates and would either have to sit by and do nothing (unlikely) or restart quantitative easing and negative rates.
This should be positive for foreign value stocks and precious metals. From the lows in 2009 the S&P 500 is up 293%. Even if you bought the S&P 500 at the peak of the 2008-2009 bubble you’d be up 80%. The dollar hasn’t tanked so dollar denominated stocks have been a winner. However, if prices and fundamentals mean something, eventually stocks will correct or the dollar will implode. When that happens it will be critical to your financial survival to have alternative investments in place.
This is part 4 of 5 of what I’ve decided to term The Economic Conflagration series where I discuss the faulty wiring pervasive the global economy:
Part 1: A Deadly Electrical Fire you Need to Know About
Part 2: The Real Economy is Weak
Part 3: Crushing Debt in the United States Limits Economic Growth
Part 4: Stocks are Overpriced and Due for a Significant Crash
Part 5: What you can do about it
Part 5 will be release in the coming weeks. Subscribe below to ensure you don’t miss it.
by John | Feb 5, 2018 | Economic Outlook, The Stock Market
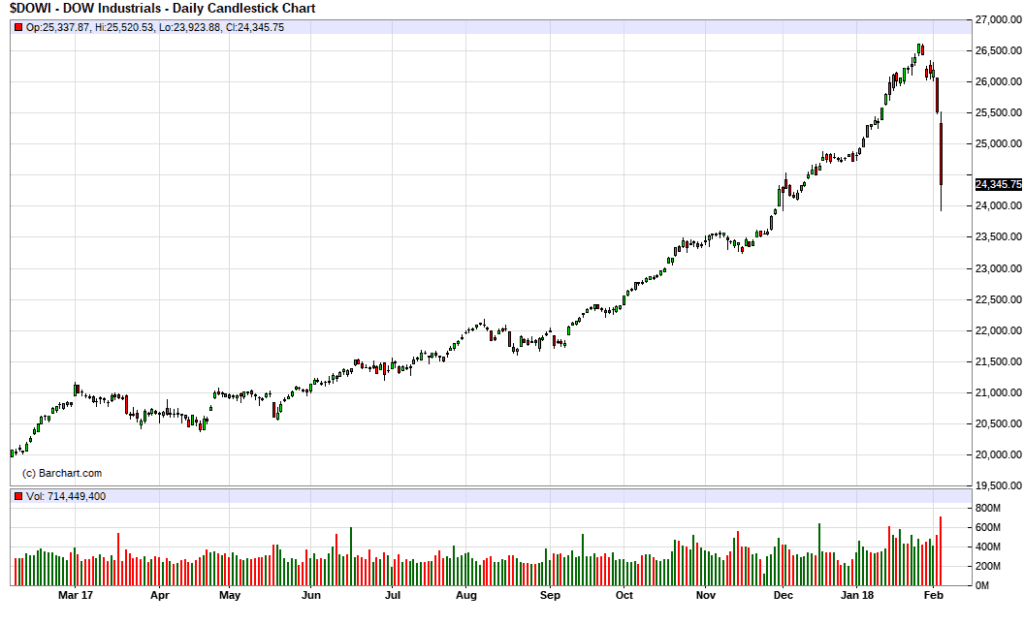
Today the Dow Jones Industrial Average dropped 4.6% and went negative for the year.
Investor’s Business Daily summarizes the pullback very well:
“The Dow Jones industrial average fell by 1,175 points on the stock market today, plunging nearly 1,600 points at session lows. Those were the worst one-day and intraday point losses ever for the blue-chip index, something trumpeted across most financial media.” -Investor’s Business Daily
Source: https://www.investors.com/news/dow-suffers-worst-point-drop-ever-but-percentage-loss-not-historic/
However, as Investor’s went on to point out, in percentage terms this is hardly historic.
The real question in my mind is, “does this mark the beginning of a larger selloff?” The Dow was also down on Groundhog Day, that is Friday the 2nd. So this marks two days of declines, with today’s selloff being even larger.
Volatility is Back
Volatility in the market has spiked tremendously as measured by the Chicago Board Options Exchange Volatility Index (VIX). You have to go back to 2015 to see volatility this high.
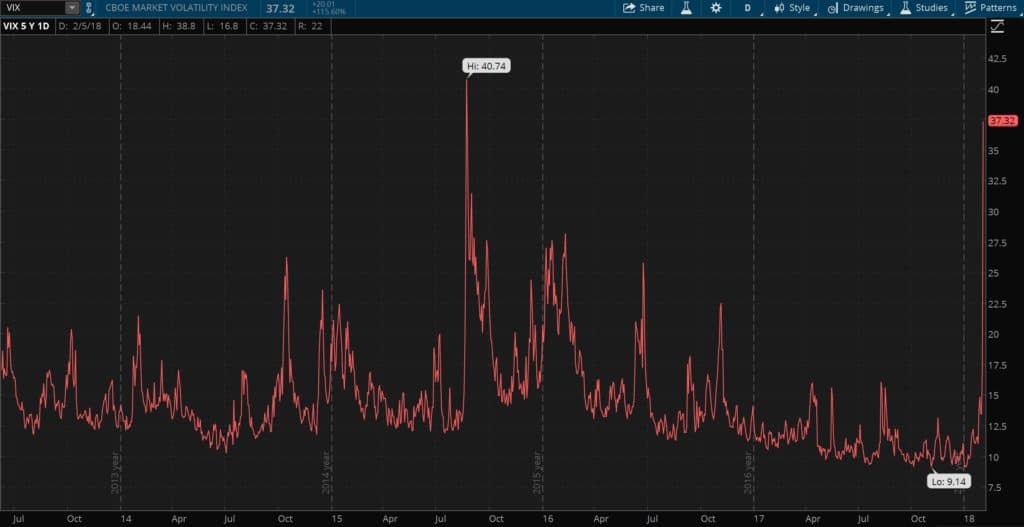
For all I know the market will stabilize tomorrow or the next day, but it is interesting to me that volatility, which as you can see had been declining for the past two years, is now back in the market.
Gold Stable
Gold was flat/slightly up today.
Cryptocurrencies Continue to Tank
Cryptocurrencies continue to tank. Bitcoin is trading around $7,000 (down from the December 2017 highs of $20,000). Ethereum is down to $700 (from the the January highs of nearly $1,400). Other cryptocurrencies have sold off similarly in the past few months but actually rallied modestly as the Dow and other stock indices sold off today.