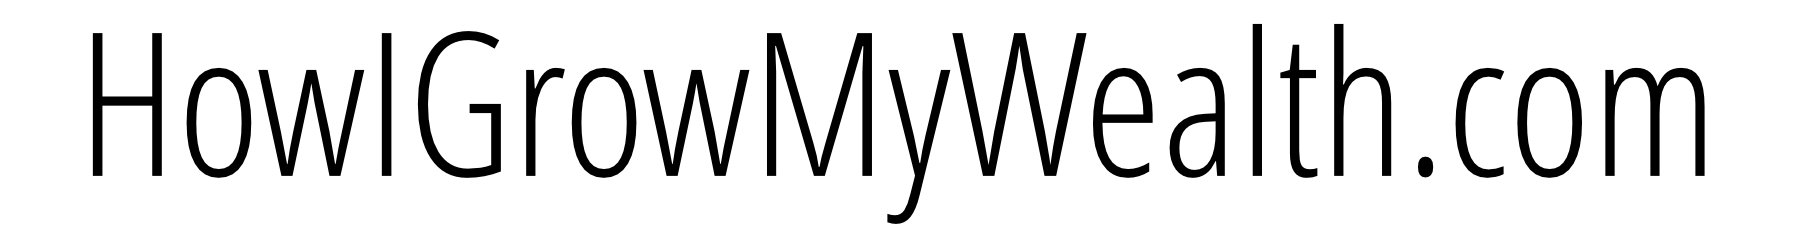

Gold has been steadily rising in an ascending triangle trading pattern since December of 2015. It’s my belief that gold bottomed in December of 2015 at $1045.4 per ounce. I don’t believe that gold will ever trade below $1045.4 again.
The highs being around the same level and then falling combined with progressively higher lows is what leads me to describe the last three years of gold price moments as an ascending triangle.
The high since gold bottomed in 2015 is $1,377.5 which occurred on 6 July of 2016. In the time between then and now gold has failed to match this high or make a new one. The price of gold has come within $20 on five separate trading days–three of which were in 2018 and one of those breakout attempts was last week.
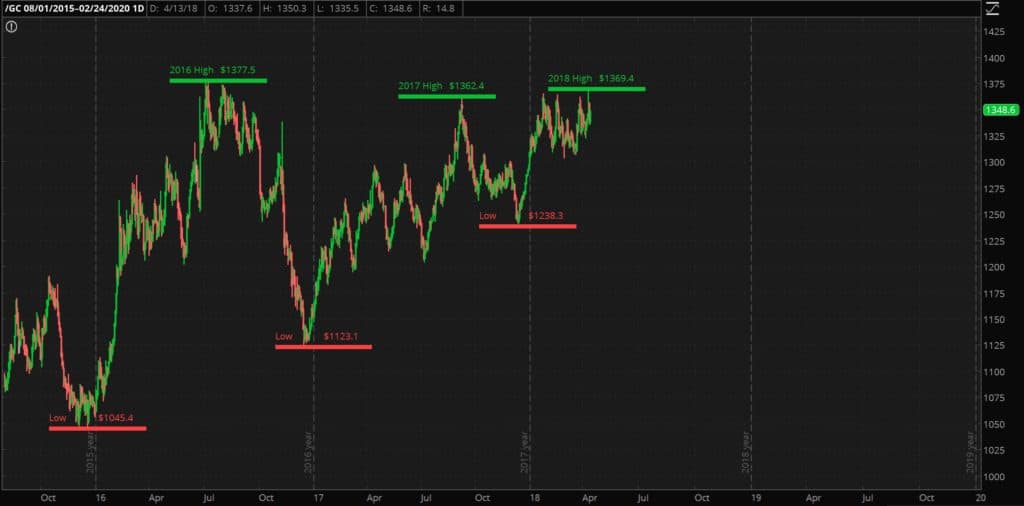
Gold has been trending upwards in an ascending triangle. The blue dashed line is what I’m calling the December 2015-December 2016 support trendline
Fundamentals for What to Buy and Charting for When
Charting is more of an art than a science and I don’t think it works well in isolation. The fundamentals of an investment need to be in place to determine what to invest in and charting may provide some insight into when an investment will move in a given direction.
Now commodities don’t have balance sheets or cashflow so the fundamentals are based on supply and demand.
The supply of gold, while growing, is fairly static, I anticipate the demand to increase substantially given my view that stocks and bonds are in a bubble and that the US Federal Reserve will step in with low interest rates and QE to reflate the bubble, as they did after both the 2000 “dot-com” crash and the 2008-2009 crisis which will eventually destroy the dollar.
It is also important to note that while the above ground supply of gold is growing, the supply of gold in the west is declining at least relative to China and India. The supply of gold might even be declining in the west on an absolute basis although I don’t know that for sure.
Even without a dollar crisis I think gold will still trend upwards over the years and it could go up several hundred dollars even without a dollar crisis simply based on technicals and trading.
Timing, however, is very challenging and it’s not a skill in which I am particularly adroit.
So I buy and hold and dollar cost average. For example if gold bounced off the lower leg of the triangle and I was under-allocated in gold I would consider buying more. At this time I already own too much gold so I haven’t been adding significantly to my holdings.
Despite gold continuing in the ascending triangle there have been some interesting price phenomena of late that merit comment.
Intraday Gold High of $1369 on 11 April
Gold hasn’t reached $1369 since August of 2016. Admittedly gold was not able hold that level last week and closed at $1356. This is still a large spike upwards. Because the fundamentals of gold are so strong I think that one of these days gold will make a new multi-year high and perhaps even hold it if it can confirm the breakout with a $50-100 move above $1377. At that point $1377 would very likely flip and represent a support level.
The $1362-$1377 has been the range of resistance for the past 2.5 years but I don’t think it will hold forever.
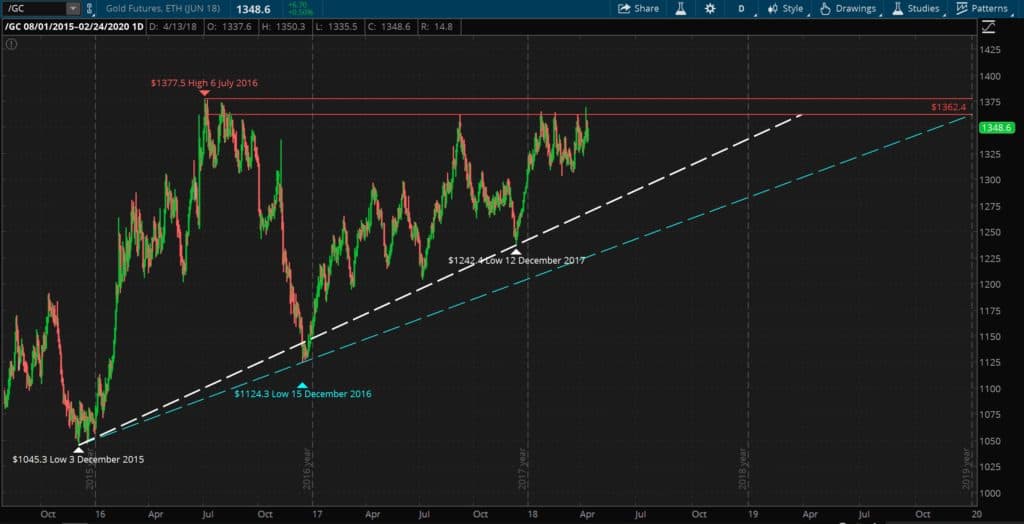
Lows are not reaching the Longer Term Trendline
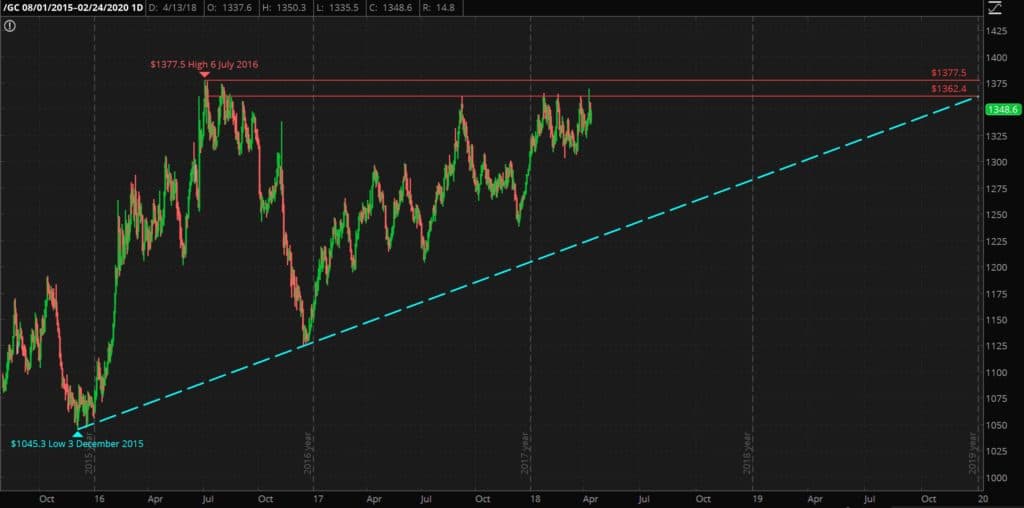
The lows have not fully dropped down to the trendline drawn from the 3 December 2015 low of $1045 to the next highest low (after a high) which was made on $1124 on 15 December 2016.
The lowest gold traded at between the 2017 and 2018 highs was $1238, and it did not reach the December 2015-December 2016 dashed blue support trendline
So while gold hasn’t been able to make it back to the 2016 muti-year high (although it has gotten within $20 five times) the lows keep getting higher.
One interpretation is that gold isn’t actually in an ascending triangle and that the December 2015-December 2016 trendline isn’t useful.
Another way to look at this price action is that gold is in an ascending triangle and the fact that the lows are getting shallower is a bullish trend.
A third is that this rally off of the 15 December 2016 low has been slower and less strong and gold will go down to hit the trendline, and may even break through, which would admittedly be bearish. It’s true that the move up nearly 32% from $1045 to $1377 only took about 6 months. It took almost 8 months to go up 21% from $1124 up to $1362.
This is where charting becomes more of an art than a science.
Compression of Gold’s Trading Range
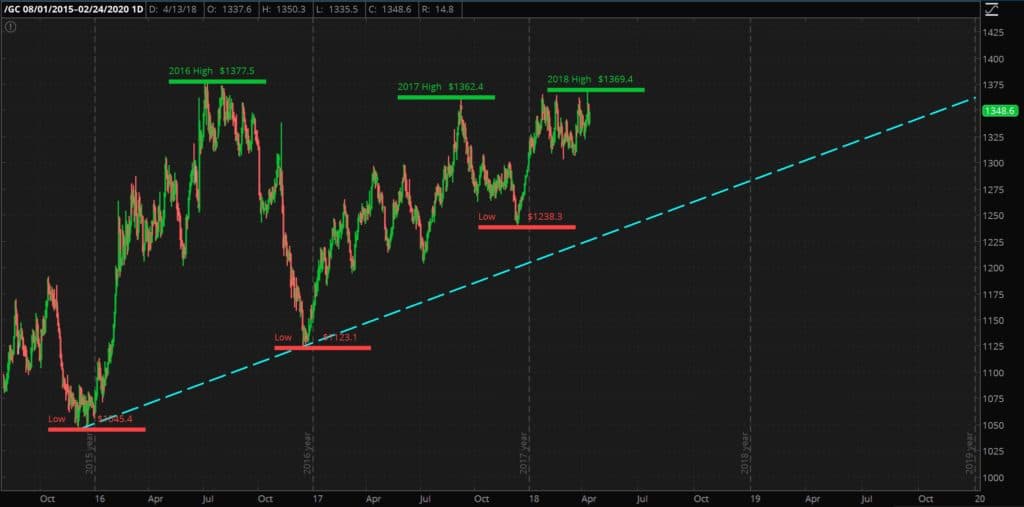
The trading range of gold is compressed, even more-so than I would expect for an ascending triangle. Again, the highs haven’t been quite as high, but the lows are much higher as well. With a few outliers gold has been trading in a fairly narrow, upward range since the start of 2017.
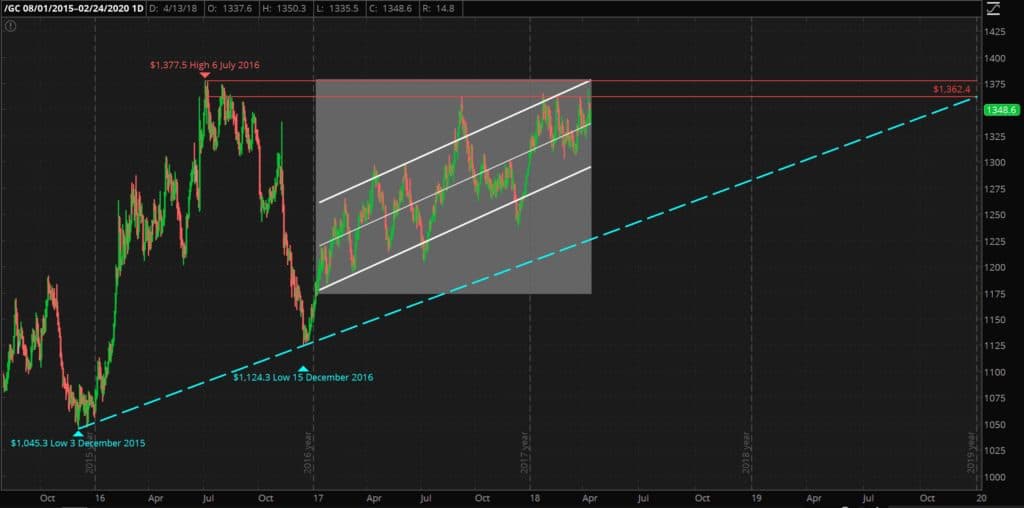
With just a few outliers gold has traded in a fairly narrow range since the beginning of 2017
As I’ve said above the lows have not fully retraced the December 2015-December 2016 trendline. Yet another interpretation of this is that gold is in a very weak and slow rally. That the highs in 2017 and 2018 don’t count because they didn’t make it fully to $1377 and we’ll retrace the December 2015-December 2016 support trendline.
However I don’t think this is the case when you factor in market sentiment.
Gold Climbing a Wall of Worry
While gold has been trending up since the turn of the century, it had been a losing investment for many years in the wake of the all time highs that were made in September of 2011 in the wake of the 2008-2009 financial crisis. Gold was in a bear market for 3 years in a row from 2013 to 2015. Except for a few months, anyone who bought in 2011 or 2012 and held through to today is still underwater.
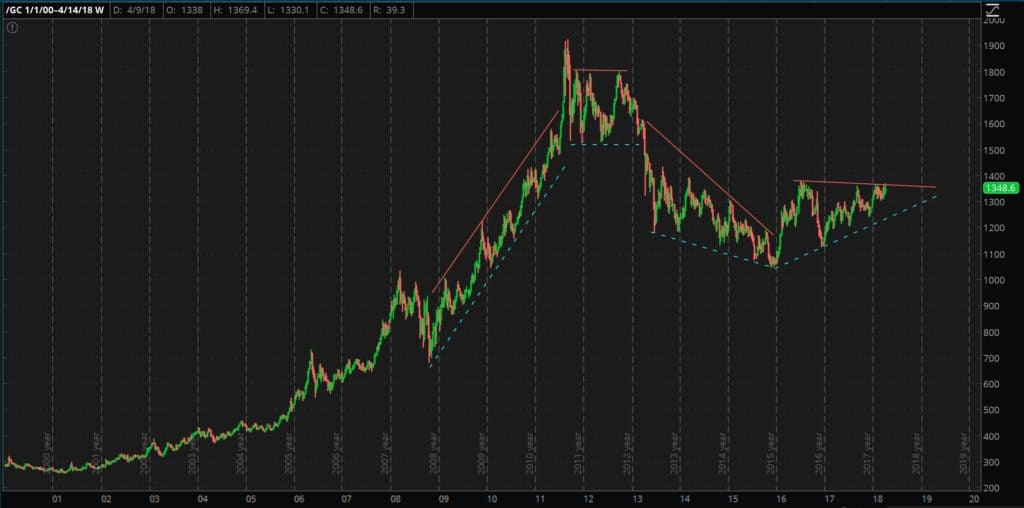
Gold has been a winner since the turn of the century
The narrative touted by Barrack Obama and now Donald Trump has been that everything is great and everything is improving. Sitting presidents always talk up the economy while they are in office because they want to get re-elected or if in their second term ensure they have a positive legacy.
Obama and Trump (at least until February 2018) have simply been after to refer to a chart of the S&P 500 as proof the economy is doing great.
So, most investors think they have no reason to own gold, since everything is great, and they don’t want to miss out on the stock market, which has been going up quite a bit until recently.
At the same time, 3 years of a gold bear market has shaken out the weak hands. There aren’t very many people who still own gold at this point who are going to sell now. If they held onto their gold as it fell from $1900 down to $1045 I don’t see why they would sell at $1150, $1250, or $1350.
So while there aren’t enough buyers stepping in to bid gold up over the 2016 high there also aren’t enough sellers for gold to drop significantly. That explains why gold can’t make new highs and why the lows continue to rise.
That is how I interpret the gold price chart.
If I’m right this also means is that when sentiment does change, when more people realize that stocks aren’t going to keep going up and that the economy isn’t great, they will move towards gold, but there won’t be many sellers, at least not at these prices. I could easily see gold going up $300 to $1600-1700 just from a technical perspective.
I do think Gold trading up to the $2000-$3000 would require a full on dollar crisis.
I don’t know when such a dollar crisis will take place. In my opinion given the debt, the lack of manufacturing, and the increase the growth the debt combined with rising interest rates that will increase the amount the US has to pay in interest on the debt are all fantastic reasons for a currency crisis to have already occurred.
Gold Market Ascending Triangle Timing
If gold is in an ascending triangle, as I believe it is, gold will break out of this pattern up or down within the next two years. Perhaps as soon as early 2019 depending on how you draw the support line. In either case I would want to see a strong move $50-100 above the $1377 resistance level to confirm trend was bullish or $50-100 below the support level as confirmation the trend was bearish.
While in the minority as gold bull I’m certainly not the only person with these views. Peter Schiff talked about the gold market trading range narrowing in a recent podcast (about 17 minutes in) and a 1 March article this year from Commodity Trading Mantra draws conclusions similar to my own.