
by John | Feb 12, 2017 | Capital Appreciation, Value Investing, Wealth Protection
Imagine if you will your fairy godmother appears and you’re given the opportunity to backdate one trade to five years ago.
You’re given 1,000 dollars and you’re presented with three investment choices.
For each option she tells you the annual gain or loss as well the average return:
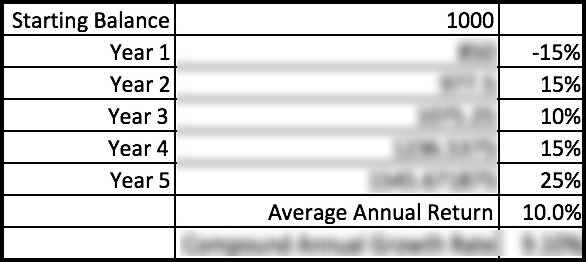
Investment One
Investment Two

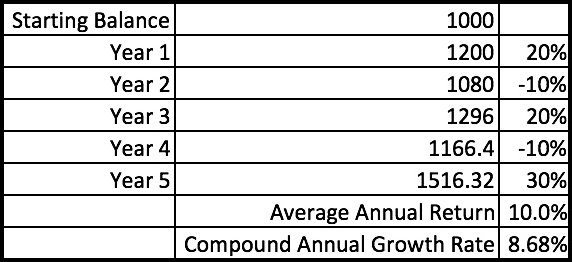
Investment Three
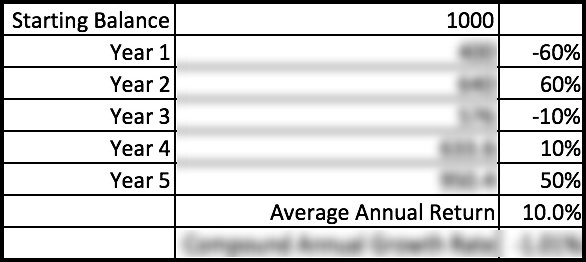
Now your fairy godmother told you the average annual return for each is 10%. So, one might be tempted to assume each investment will perform the same!
But you don’t get average returns so this number is not particularly useful.
Total Return
You want to choose the one that has the highest total return. Total return is just a fancy way of saying how much an investment went up (or down) from it’s starting value.
So you’d take the starting amount, $1,000, and add the gain or loss from the first year, second year, etc, and see how much the $1,000 is now worth after five years. The percentage increase from the original value to the ending value is the total return.
Total return would be 54.57% for investment one, 51.63% for investment two and lastly investment three has a total return of -4.96%, even though the average return for each was the the same: 10%.
Compound Annual Growth Rate
Investors typically want to know how an investment tends to perform each year. A useful way of seeing how an investment does each year in a way that smooths out up years and down year that is more useful than average returns is the Compound Annual Growth Rate (CAGR).
CAGR is calculated as follows:
Source: http://www.investopedia.com/terms/c/cagr.asp
I’ve calculated the CAGR for you below.
Investment One

Investment Two
Investment Three
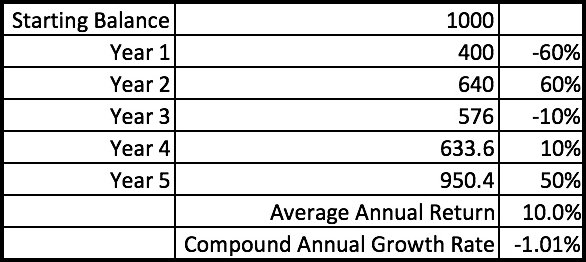
So if the fairy godmother had provided the CAGR; it would have a been a useful number to determine which investment had the highest total return.
Why Do fairy godmother’s overcomplicate things?
 Why wouldn’t your fairy godmother just give you an even $1,500 and call it a day?
I don’t know.
Cinderella‘s fairy godmother gave her until midnight to get back home. Why didn’t she give her a year to get back or just make the pumpkin turn into a carriage permanently?
Why weren’t the slippers made out of something more comfortable and durable than glass?
Cleary there is NOT a precedent for the pragmatic or straightforward. So don’t ask me to explain how fairy godmothers operate. But lest I upset the fairy godmother community I think the principle of don’t look a gift horse in the mouth also applies. After all, she’s hooking you up with the ability to backdate a trade.
You don’t get the Average Annual Return
At best the average return % isn’t useful. At worst the average return is rather deceptive–but that is the number that most mutual funds list.
While not without it’s limits, the compound annual growth rate is much more useful than average returns and it is something to keep in mind when evaluating an investment.
Average returns tell you very little while the compound annual growth rate shows you which investment would have had the highest total return.
by John | Feb 5, 2017 | Passive Income, Value Investing
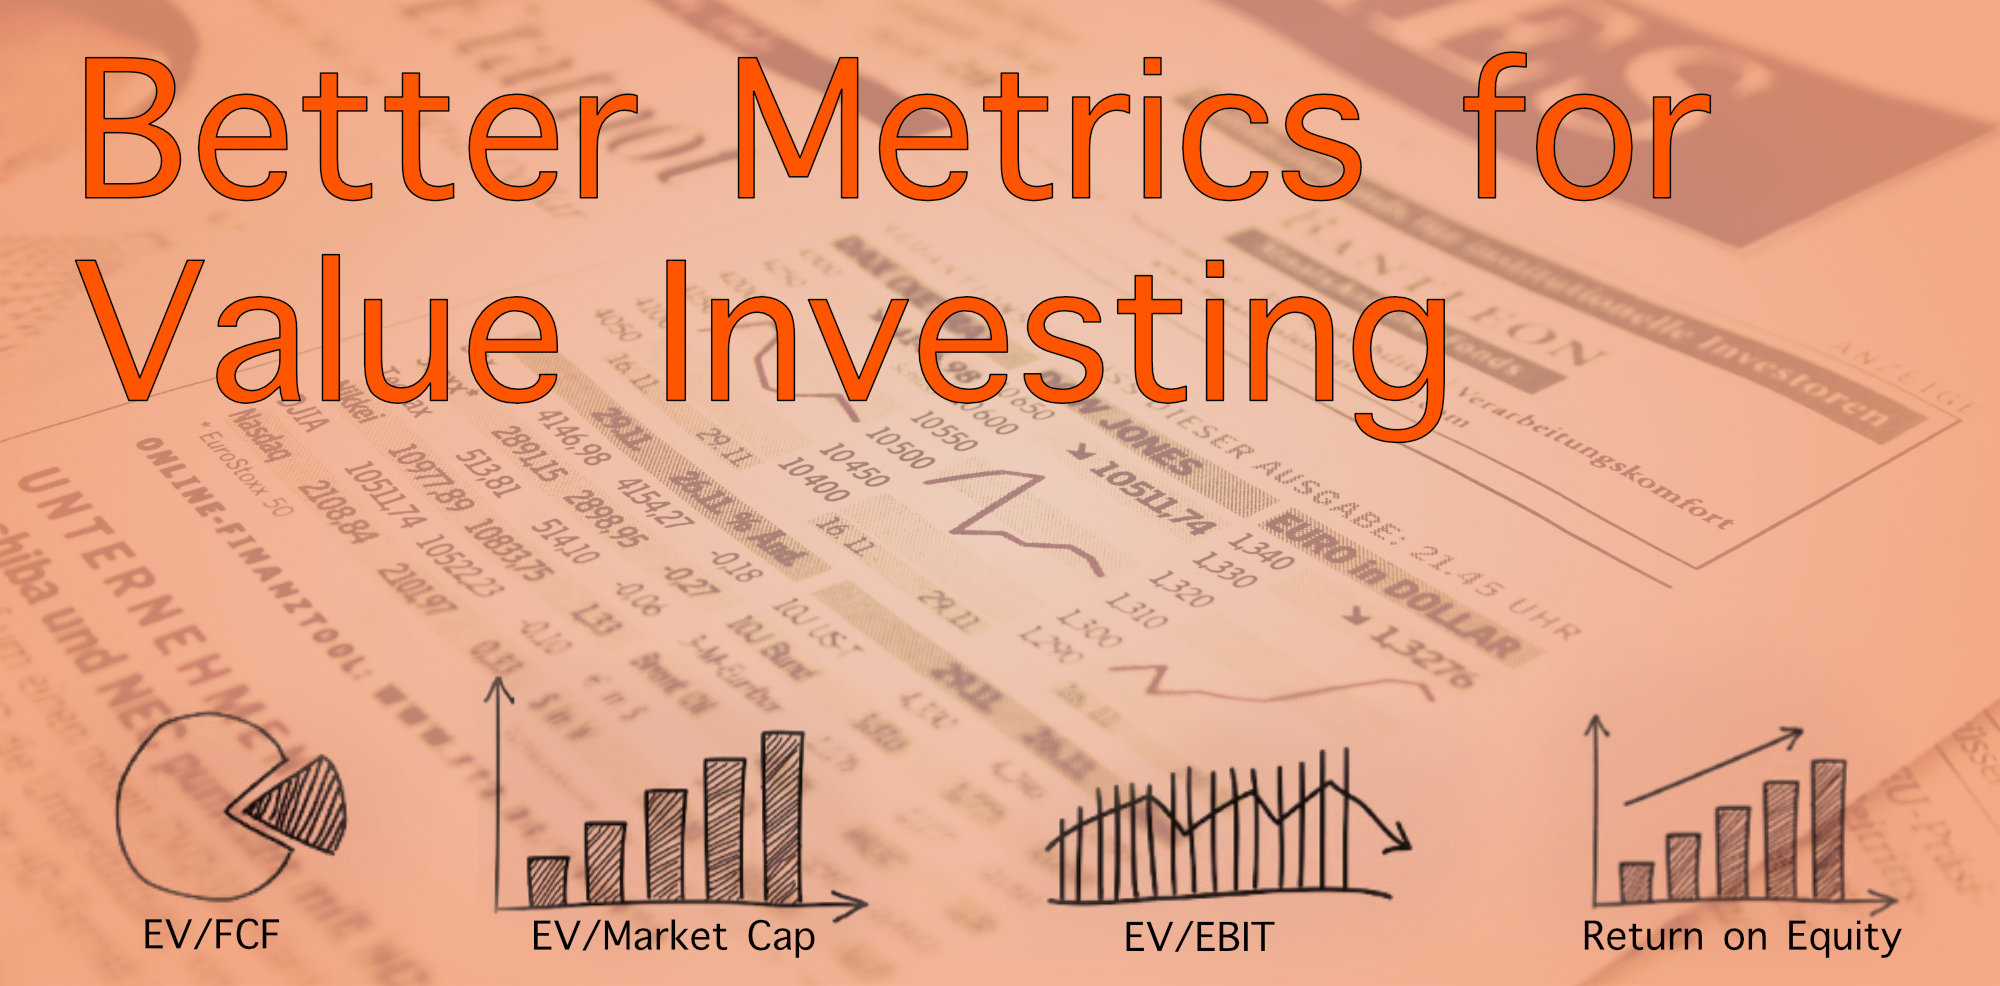
My desire for improvement has lead me to search for better metrics for value investing.
My belief in the power of value investing is unchanged but the metrics I look at have evolved.
Most people instinctively want to buy things on sale to get a great deal. But for some reason there is an exception when it comes to investing–people tend to buy stocks that are expensive.
Value investing takes the principle of finding a great deal and applies it to the stock market.
The the goal of value investing is to find profitable companies trading at a discount.
I’ve written in the past about value investing metrics and how it is one of the ways I grow and protect my wealth.
But if I can find a better and more reliable way to find a great deal I’m going to use that method.
The first reason I questioned the metrics I had been using was an article by Jason Rivera: “Why The P/E Ratio Is Useless – And How To Calculate EV” which is an excellent read.
The second was a video by Simon Black of SovereignMan.com: “How to identify the most compelling investments on the planet“.
Better Value Investing Metrics
So what metrics am I using to find great deals on stocks?
1) Enterprise Value to Market Capitalization (EV/Market Cap)
2) Enterprise Value to Free Cash Flow (EV/FCF)
3) Enterprise Value to Earnings Before Interest and Tax (EV/EBIT)
4) Enterprise Value to Owners’ Cash Profits (EV/OCP)
5) Operating Margin
6) Dividend Yield
7) Return on Equity (ROE)
If you aren’t familiar with some of these terms, no worries, just click on the word to view the definition in the glossary.
The Metrics
Enterprise Value to Market Capitalization (EV/Market Cap)
This ratio indicates if a company has more cash than debt. I look for a value of less than 1, the lower the better.
If a companies EV or TEV is less than its market cap its means that the company has more cash than debt. And may be undervalued. Inverse is true as well.
Source: https://www.quora.com/What-does-it-mean-when-enterprise-value-is-more-than-market-cap
Enterprise Value to Free Cash Flow (EV/FCF)
This is a more reliable metric than price to earnings (PE) (more on that in a subsequent article). It takes the enterprise value and divides it by free cashflow. I want this to be as low as possible.
A lower number indicates one is paying less for a stream of cash flowing into a company than compared to a higher number.
Enterprise Value to Earnings Before Interest and Tax (EV/EBIT)
Another metric that is more reliable than PE. It’s a way to double check the cost of a cashflow stream. The lower the better.
Enterprise Value to Owners’ Cash Profits
A third replacement for PE.
If EV/FCF, EV/EBIT, and EV/OCP are all low, that is several metrics that indicate the stock is trading at a discount relative to peers with a higher ratio.
Operating Margin
This is a measure of efficiently. A higher operating margin is better than a lower one.
Dividend Yield
A company can’t fake dividends. The dividend is money that goes directly to a shareholder and the yield is how much the dividend costs as a function of the share price. Investing in a stock with a dividend yield is also a way to collect income while waiting for the company’s share price to rise in value to reflect the fundamental indicators.
The higher the dividend yield the better–all else equal.
Return on Equity over 8%
This is another metric that indicates if a company is profitable. Relying on multiple metrics versus one or two provides multiple failsafes to increase the likelihood one is purchasing a valuable company at a discount.
The Stocks I Like Based on These Metrics
I list my Value Stock Picks, which are based on the value investing metrics I use.
Subscribers to the HowIGrowMyWealth Email Newsletter know that I’ve been selling a fair amount of stock as a result of these refined metrics.
Some of that is profit taking, but these metrics have also enabled me to see problems with certain stocks that I otherwise thought were a great value.
HIGMW Email Subscribers also learned of my latest value stock picks back on the 2nd of February.

by John | Jan 29, 2017 | Capital Appreciation, Stocks I Like, Value Investing, Wealth Protection
I don’t know how to time the market.
I wish I did.
If I could do marketing timing I would have bought US stocks in in the early 90s (I was pretty young but still!). Sold in early 2000, bought in October 2002, sold in October 2007, bought in March 2009.
That would be fantastic.
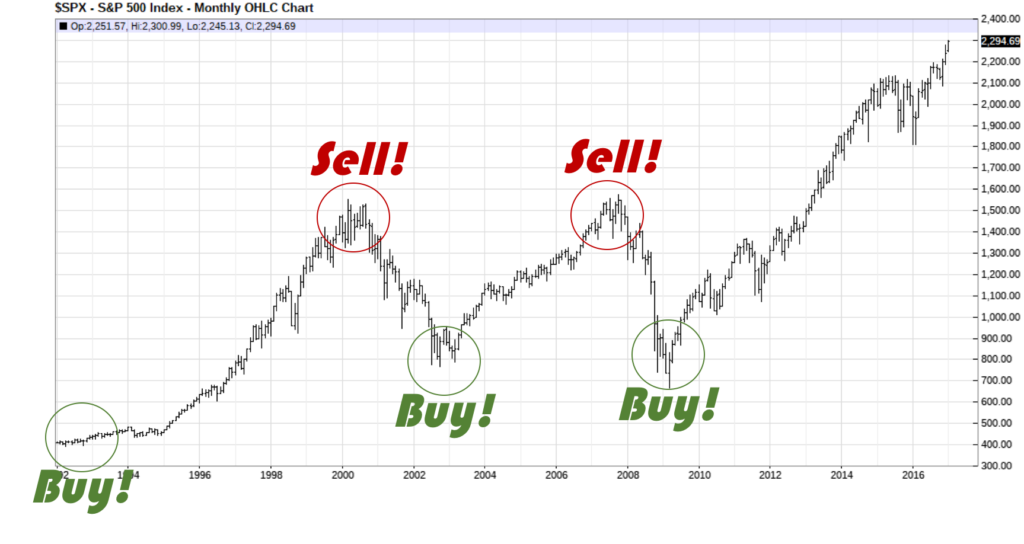
S&P 500 Market Timing Guide (Only Available in Hindsight)
Unfortunately I’m only good at timing the market in hindsight.
This of course isn’t useful, since my broker doesn’t let me backdate trades.
John: “[Phone rings] Hello, TD Ameritrade?”
TD Ameritrade: “Yes, this is TD Ameritrade.”
John: “I would like to buy 100 shares of the Vanguard S&P 500 Fund at the 1992 price.”
TD Ameritrade: “….[click]”
In all seriousness though, the above chart does say something about the long-term benefits of buy and hold (but you have to buy and hold for very long periods of time and suffer through large drawdowns).
But I’ve always wanted to do better than a long term buy and hold strategy. I think the best way to do that is through value investing.
US Stocks and Bonds are Overvalued
Today I was reading a MarketWatch.com article by Thomas H. Kee Jr. in which he states, “Ultimately, liquidity matters more than valuation to professional investors, and it is far more important to the market than any of the noise we are hearing.”
I think he is right insofar as what professional investors care about. The performance of US stocks since 2009 bears this out.
This is also supports my belief that US stocks and US bonds are in a bubble, the rise in price of these asset classes is based on liquidity (central bank money printing) and NOT valuations.
But if markets have anything to do with the real economy security valuations will eventually return to a market-based and realistic level of valuation regardless of central bank injections of liquidity.
Let me summarize what I’ve said so far.
1) Stocks and bonds are in a bubble due to central bank manipulation called “liquidity”
2) I don’t know how to time the market
In other words I know that stocks are overvalued but I don’t know when they will revert to a valuation based on company performance and realistic valuation.
So I don’t want to buy stocks that I know are overvalued when I don’t know when they will crash.
Buy Stocks at a Discount
I don’t know how to time markets and I believe US markets overvalued so I take the approach of value investing.
By investing in stocks that are trading for less than their book value I have a built in margin of safety.
That way I have good reason to believe I’m not buying a security that will drop radically in price since a value stock is by definition already undervalued.
I think it’s a great way to grow wealth in good times and bad.
Later this week I’ll be unveiling some additional refinements to my value investing metrics.
[mc4wp_form id=”4538″]

by John | Jan 22, 2017 | Geopolitical Risk Protection, Value Investing, Wealth Protection
For better or worse the President of the United States gets credit (or blamed) for how the economy has performed during his tenure.
How much control does the President have over the economy? In my opinion more than he should have but less than people give him credit for.
Donald Trump was sworn in a couple days ago and there is alternating fear and hope from either side of the aisle about what he will or won’t do.
But as I’ve written before, when it comes to some of the largest systemic issues facing the United States: it doesn’t matter who won.
How has the US Economy Fared under the last three Presidents?

Pals
As part of trying to anticipate how the markets will fare under Trump I was inspired to take a brief look back at how “the economy” performed during the past three presidents’ terms.
Past performance does not guarantee future results but the past is all we have.
For my high-level assessment I looked at US national debt, the price of gold and the S&P 500.
These three areas are just scratching the surface of the United States economy.
Other metrics one could look at are GDP (which I don’t think is useful), unemployment rate (deceptive), the Consumer Price Index (CPI, which has been resigned so that it doesn’t measure consumer prices), labor force participation, dollar strength relative to other currencies, home ownership, household debt, etc.
However as an investor I’m mainly interested in getting any clues as to how stocks and precious metals are going to perform.
Keep in mind these trends have more to do with Federal Reserve actions, regulations, laws, and government spending and less to do with who is taking up space in the oval office.
Slick Willy

Former President Bill Clinton and Former First Lady of the United States Hillary Clinton
Under President William J. Clinton, the US national debt went from $4.2 trillion to $5.73 trillion, the price of gold fell 30% and the S&P 500 went up 182%. The housing bubble also started to form under Clinton.
Bonus: During the Clinton reign the NASDAQ tech bubble popped and the index went from it’s high of 4,696 down to 2,500.
To be fair, if you bought the NASDAQ in 1993 you would been up almost 300% by the end of Clinton’s term. But that doesn’t help anyone who bought in during the peak.
W

Former President George W. Bush attempting to wear a poncho.
Under US President George W. Bush the housing bubble continued to form and peaked. This bubble popped resulting in the 2008 financial crisis, the national debt nearly doubled and went from $5.73 trillion to $10.63 trillion, gold went up 222% and the S&P 500 dropped 41%.
In an attempt to paper over the 2008 financial crisis a stock and bond bubble also started to form in Bush’s last year.
Bonus: Under the Bush regime, during the 2008 financial crisis the S&P 500 went from it’s peak of 1550 down to 805.
One of the worst things Bush did from an economic perspective was to appoint Federal Reserve Chair Ben Bernanke in 2006.
Based on all his public comments Bernanke was completely blindsided by the 2008 financial crash and is perhaps most responsible for the current stock and bond bubbles.
Obama

Former United States President and Golfer in Chief, Barack Obama
Under US President Barack H. Obama, the stock and bond bubbles grew to a capacious size, national debt went from $10.63 trillion to nearly $20 trillion, the price of gold went up 30% and the S&P 500 went up 175%.
Bonus: Under Obama’s rule, the labor force participation rate dropped down to a level not seen since the late 1970s. And no, it’s not because of baby boomers retiring.
Double Bonus: During Obama’s entire tenure as President the Fed Funds rate was never over .75%. Except for Obama’s last year in office the Fed Funds rate was below .25% for his entire presidency.
There has never been a period in US history that interest rates were that low for that long.
This means Obama presided over the US economy while the largest economic bubble to date was blown.
Interestingly, Obama retained the Bush appointed Fed Chair Ben Bernanke for the majority of his presidency. It was over five years into Obama’s presidency that Bernanke was replaced by current Fed Chair Janet Yellen.
Blow a Bubble, Let it Pop, Repeat
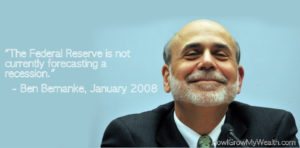
Bernanke could not correctly forecast the present
As you can see from the chart below, the S&P 500 grows in a bubble, then the bubble pops.
Obama truly lucked out.
During Obama’s tenure there was no significant correction, there was also no significant attempt to normalize interest rates and the bubble has grown even larger than past bubbles.
This means that when the stock and bond bubbles do pop the fallout will be much worse.
Most people don’t understand how the Federal Reserve fuels asset bubbles.
Unfortunately for Trump, the bubble will probably pop during his first (and thus only) term and he (and free-markets) will be blamed for it.
Free markets and deregulation are not the cause of these bubbles: it’s government spending, moral hazard created by the government, harmful government incentives and the Federal Reserve.
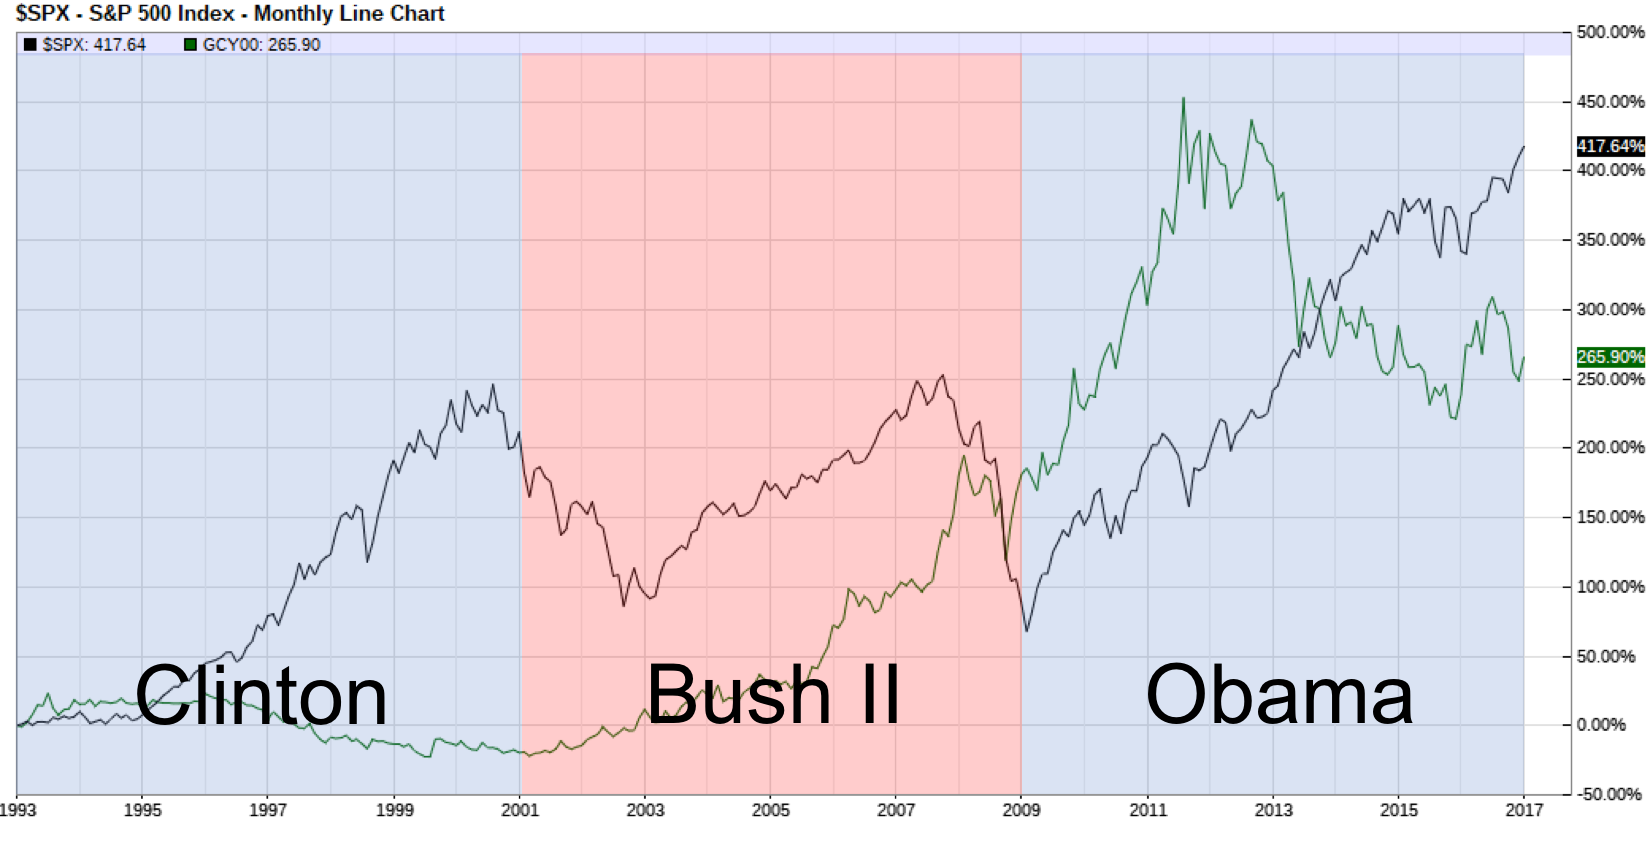
Green Shows the % increase in the price gold, Black shows the % increase in the S&P 500
What Can the Past Tell Us about the Future
History might not repeat itself but it does rhyme.
In many ways the Trump presidency, from an economic and market perspective, is starting off similarly to George W. Bush’s presidency.
Both Bush II and Trump inherited a bubble economy that formed under his predecessors. Bush continued to grow the housing, stock and bond bubbles and made them worse. Trump will probably do the same to the existing stock and bond bubbles.

Buddies
But the stock and bond bubbles will burst eventually.
It’s nigh-impossible to predict exactly when, but at some point valuations of US debt and US stocks will revert to their historical averages and more realistic valuations.
I thought theses bubbles would pop while Obama was in office but I was wrong. I think the bubbles will pop during Trump’s first term and I don’t anticipate being wrong again.
When the bubble does pop, the government will react the way it always does. Lower interest rates, print money, lower taxes (maybe), and spend, spend, spend.
This doesn’t work but it’s the only playbook the government knows.
I believe real assets and foreign stocks will perform well in this environment.
Trump’s Plans
 Trump has talked about lowering taxes and reducing regulations.
These actions would benefit the US economy.
But Trump would also need to significantly reduce government spending. The US government is already insolvent and reducing taxes without also reducing government spending would only increase US national debt.
However, because most government spending is on the military, social security and medicare there is practically no chance Trump will actually reduce government spending.
Thus the US national debt will continue to grow and I believe will double to $40 trillion.
I hope I’m wrong.
Trump has also talked about tariffs, infrastructure spending, and how the dollar is too strong (implying he will try to weaken it).
These things are all bad for the US economy.
Over the next four years I believe the stock and bond bubbles will collapse. I also think the dollar will lose a great deal of value and the price of gold will outperform and reclaim the 2011 high of $1,920.
What John is Doing
So what is one to do in the age of Trump?
I know what I’ll be doing to grow and protect my wealth.
It’s the same things I’ve been doing:
Investing in Foreign Value Stocks
Purchasing Gold
Investing in alternatives like peer to peer loans
Holding some Cash
I’ve got those setup to both grow and protect my wealth. I also work in my day-career in financial services earning US dollars to spend on the necessities of life and to convert any excess funds to the assets I’ve mentioned above.
I’m excited about the Trump presidency.
Not because I expect him to do the right thing or because I think he can or will fix the foundational systemic issues with the US economy; but because this is a time of great opportunity for individuals who take the appropriate steps to protect themselves.
by John | Jan 9, 2017 | Options, Stocks I Like, Value Investing
Value Stock Picks – January 2017
I’m a value investor which means I buy stock in profitable companies trading at a discount.
I’ll be tracking the stocks I like over at my Value Stock Picks page.
The information presented here, like all the content on this website, is not investment advice. These are stocks I own (or intend to own) but they might not be suitable for you. The information presented is accurate to the best of my knowledge, but no guarantee of accuracy is made.
Prices are as of 11 January 2017 on market close, unless otherwise noted. Market data is from morningstar.com.
Korea Electric Power Corp (KEP on NYSE)
| Price |
Market Cap |
Shareholder’s Equity |
Price to Book |
Earnings per Share |
Yield |
Return on Equity (TTM) |
Price to Earnings (TTM) |
| $18.27 |
$23.5 bil |
$56.3 bil (converted from KRW) |
0.4 |
$8.74 (converted from KRW) |
7.63% |
12.2% |
3.3 |
 Korea Electric Power Corp “KEPCO” is a large cap electric company that transmits and distributes nearly all the electricity in South Korea.
I like this stock because the company pays a very nice yield. They have net income growth the past three years. I also think that people aren’t going to stop using electricity anytime soon, so it is in a good industry. With a price to book of just 0.4 it’s a steal.
It is an ADR, which isn’t my preference. But is is optionable.
I own 100 shares of KEP and have sold a covered call.
Brookfield Property Partners (BPY on NYSE)
| Price |
Market Cap |
Shareholder’s Equity |
Price to Book |
Earnings per Share |
Yield |
Return on Equity (TTM) |
Price to Earnings (TTM) |
| $22.17 |
$5.8 bil |
$7.4 bil |
0.8 |
$3.6 |
5.05% |
6.9% |
6.6 |
I would rather own real-estate directly because doing so provides crazy tax benefits. Despite looking into real estate previously I’m not in a position to join the class of landed gentry.
An alternative way to be a part of the real estate market is through a real-state investment trust (REIT).
A REIT is a company that owns, and often operates, income-producing real estate.
Like many other companies Brookfield Property (BPY) has issued stock that can be purchased.
BPY is a REIT that pays a nice 5% dividend and is currently trading at a 20% discount to it’s book value. It’s had modest revenue growth over the past three years and is profitable.
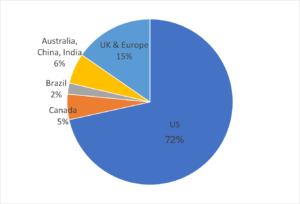
The properties BPY owns operates and invests in are located in North America, Europe, Australia and Brazil.
Unfortunately most of the assets under management are in the US (72%). I would prefer seeing more exposure in Brazil, Australia, and Asia.
Source: http://bpy.brookfield.com/~/media/Files/B/Brookfield-BPY-IR/events/BPY%20Corporate%20Profile%20November%202016%20FINAL.pdf
BPY is optionable. I currently have an option position on this stock and intend to acquire shares of this stock directly in the near future.
by John | Dec 18, 2016 | Options, Passive Income, Value Investing, Wealth Protection
I’ve decided to pivot towards a more passive option approach with covered calls.
The reason is twofold. First, I haven’t done well with options (except for August) because of mistakes I’ve made.
Back in November, after the surprise election of Donald Trump and the ensuing stock market melt-up, my option positions blew up and I lost around $1,500. My account size at the time had been around $10,000 so that is a big, big percentage loss over a short period of time.
The second reason is I don’t have free time during trading hours.
Reason One: I Made Mistakes
It should not have mattered much when the markets moved a lot. I pay to follow Kirk DuPlesis’s trades over at OptionAlpha.com. Kirk was only down around 2%. I was down around 15% even though I was in very similar positions.
Why the difference?
The main mistake I made is that I only had about $100 in free margin, which is a big no-no. I should have had $5,000 in margin available. Because I only had $100 when the markets went crazy I didn’t have any dry powder to make adjustments add additional positions to balance out the portfolio or hold positions to expiration.
Kirk was using around 50% of his available margin, so he is able to hold positions to expiration, make adjustments, sell additional premium, and keep his portfolio diversified.
It’s frustrating because while I know the rules I wasn’t following them.
Follow the Rules to Be Successful
To be successful trading options long-term there are several inviolable rules: small position sizes (1-5% of the portfolio per trade), only use half of your available capital, and place a lot of trades so the probabilities work out.
There are other factors too, like using the correct strategy, making high probability trades and being on the right side of volatility, among others.
But I don’t follow the rules! I’m afraid of missing out on a trade, or I allow myself to make an exception “just this once”, or I get greedy. And it burns me every time!
So I’m putting myself in time-out.
I’m going to stop trading options for a while. I haven’t had the discipline to follow the rules that must be followed in order for the math work out in my favor and be successful.
Reason Two: I Have Less Time
Not only that but I don’t have the free time I did when I was seeking out a new, full-time career.
Even though it might be possible to trade options and work a full time job it’s hard. One is confined to placing limit GTC orders before or after work or trading over lunch. However, a lot of the market movement tends to happen in the 30 minutes after the market opens and 30 minutes before the markets close.
When I was doing a lot of trading (July-September) I didn’t have a day job. I had this website, option trading, and selling coins. I set my own schedule.
Now I’m on the road or in appointments 8-9 hours a day during trading hours and I rarely have time to place 3-4 trades 30 minutes before the markets close. I don’t have time to make the appropriate adjustments to existing positions and I don’t have time to look for new trade opportunities.
I need a more passive approach.
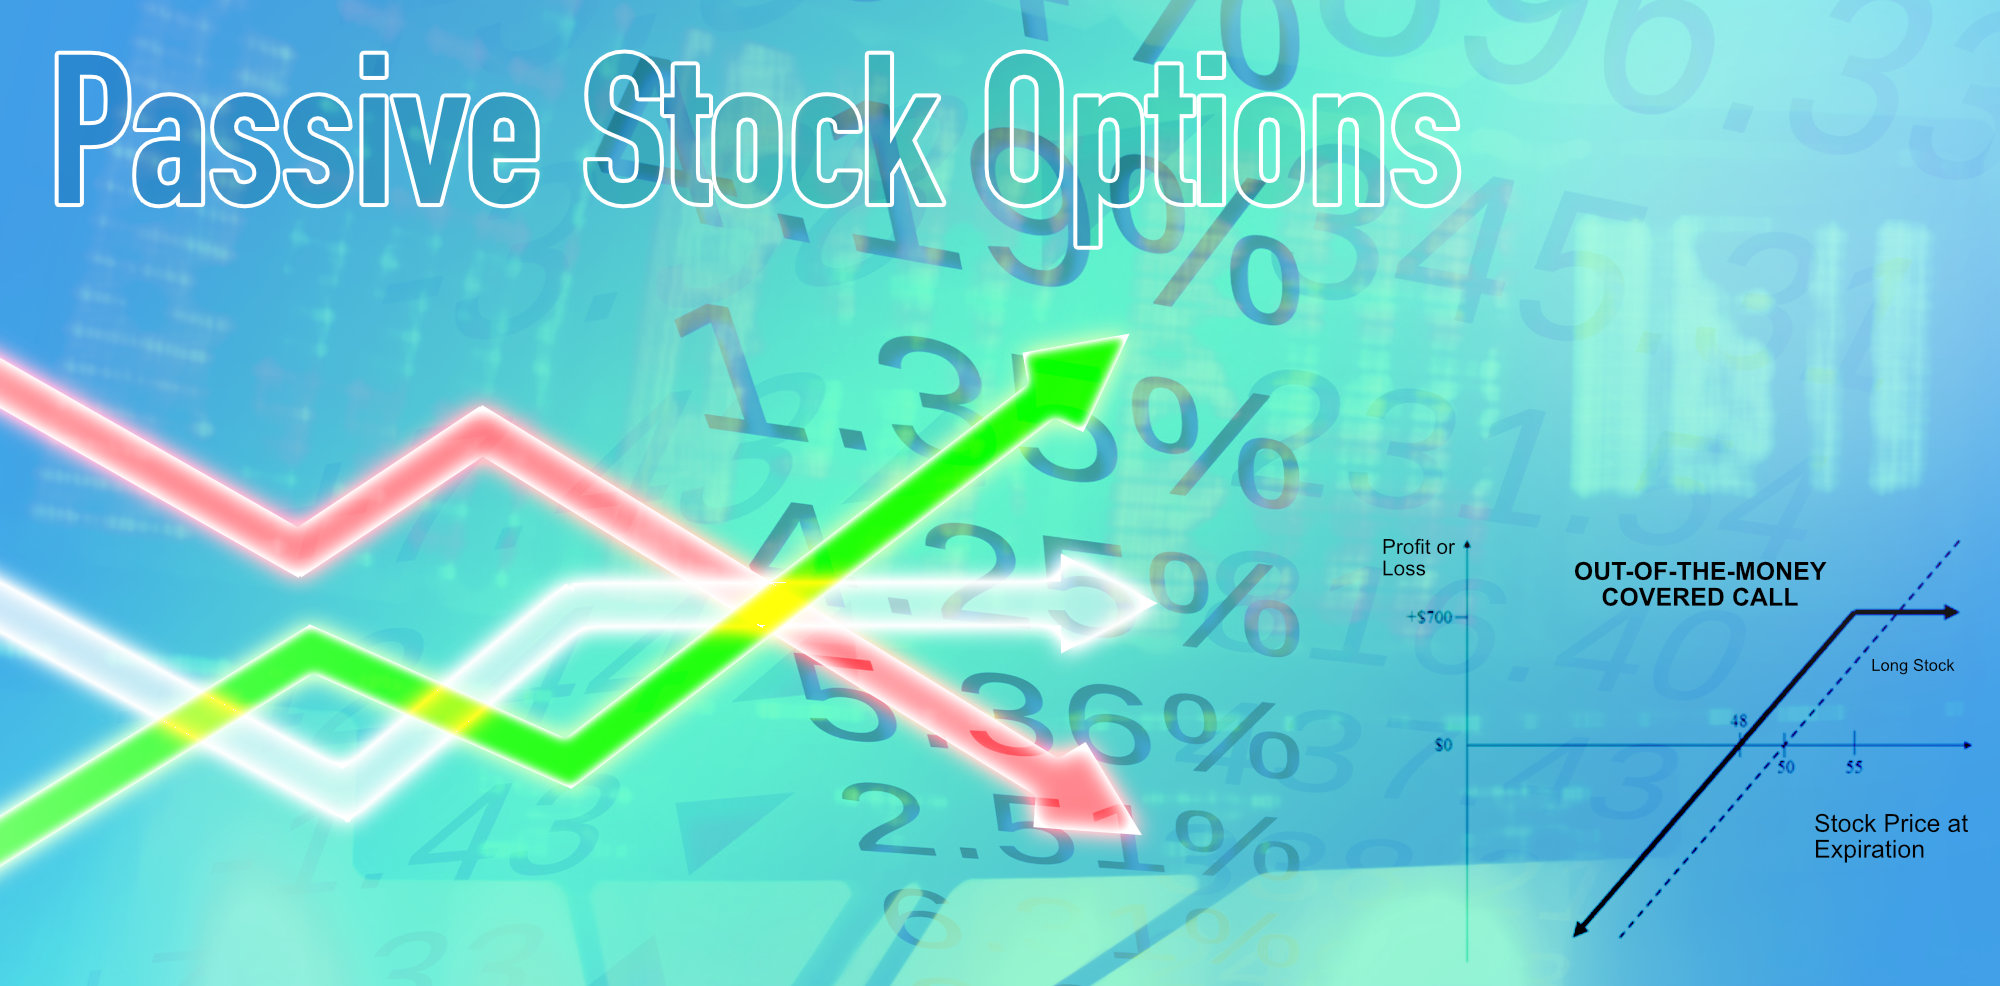
Covered Calls
So I’m winding down my existing option positions. I’m also increasing holdings in some of my Value Stock Picks and selling some covered calls on them.
Covered calls they work like this: first buy shares of a stock, say 100 shares of Acme Amalgamated for $40/share. Then sell an out of the money (out of the money for a call option contract would be a contract with a strike price above where the underlying stock is currently trading) call contract for a theoretical $100 premium. 10% out of the money would be a $44 strike price.
A call contract legally obligates the call option seller to sell 100 shares of the underlying stock to the option contract buyer at an agreed upon price (the strike price) at any time before the contract expires.
For a more in-depth introduction to covered calls I suggest checking out Investopedia.
With the covered call approach, I sell an out of the money call with a strike price about 10% above where the stock is currently trading, with a contract expiring 30-60 days out, and I buy 100 shares of the underlying stock. This provides some downside protection, regular income (from the option premium) and the only downside versus owning the stock outright is gains are capped at 10% until the contract expires.
With covered calls three things can happen.
1) The stock goes down
In the above example, the stock price could drop as low as $39 at the time of expiration and the position would still break even. Because even though $100 would be lost on the price of the stock (if one were to sell) the call option would expire without being exercised and the $100 premium is still retained.
If the stock fell below $39 a loss would occur, but it would be $100 less than it would otherwise be.
2) The stock goes up or down a small amount, or stays the same price
A $100 profit would be realized plus or minus the gain or loss of the stock. If the stock price was below $44 at expiration the sold call would expire worthless and not be exercised.
3) The stock goes up beyond the strike price
In this case the position would return about 10%. It would be $400 gain plus the $100 option premium. One could either close out the call contract for a wash/loss or just let the position get assigned and the 100 shares of ACME bought for $40 per share would get sold for $44 per share.
So by selling covered calls, you give up some upside potential in exchange for some downside protection and recurring income.
But if I could make 10% every 60 days I’d be thrilled. Lets say the stock is on a tear, and it goes up 15% in the first 30 days and I get assigned, I’d still make 10%. I could then buy the stock back and sell another covered call 10% out of the money, at the end of 30 days the stock goes up another 15%, I would have still make an additional 10%, etc.
I think it is a good strategy if you can execute it correctly. Plus it doesn’t take a lot of time.
Some important elements:
1) Picking a good stock
I want to sell covered calls on stocks (or ETFs) that I want to hold for the long term. I’ve previously talked about what metrics I use for selecting stocks.
Another strategy, for example, is to buy an S&P 500 ETF like SPY and sell covered calls on it.
2) Discipline
You need to limit risk and diversify in non-correlated assets. It’s a temptation to buy into the latest hot stock and sell calls on it, or try to use too much leverage on a position. Another temptation could be buying too much stock in a given company or industry.
I would like to go back to trading options in a more active way someday. And I’m not saying I won’t make the occasional earnings trade but if I get back into actively trading options it will require puritanical adherence to the rules.