With several states considering reopening in May, at least in some capacity this trend will certainly be disrupted and the rate of active case growth will probably rise again.
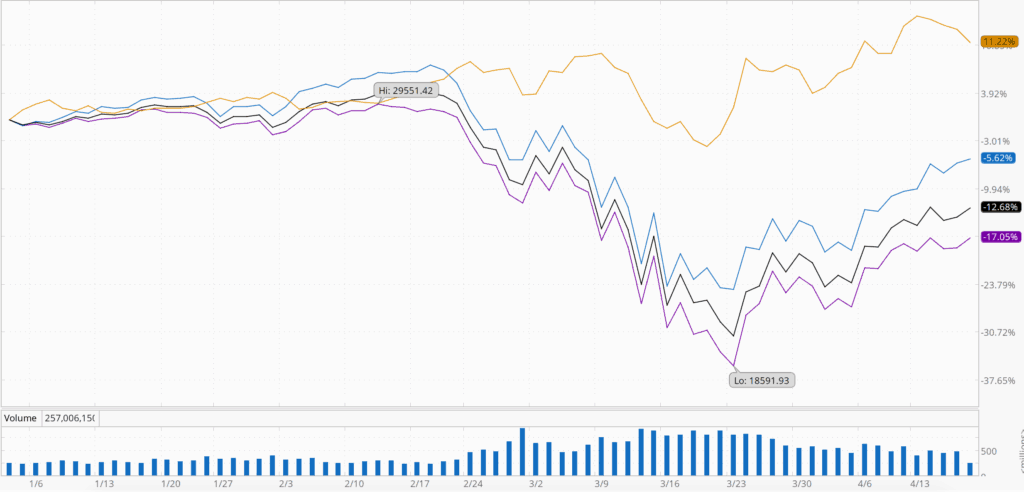
Not surprisingly, the major US indices bottomed a few days later on 23 March.
Year to Date, the S&P 500 (black) is down 12.6%, Nasdaq (blue) is down 5.52%, Dow Jones (purple) is down 16.96% and gold (yellow) is up 11.16%
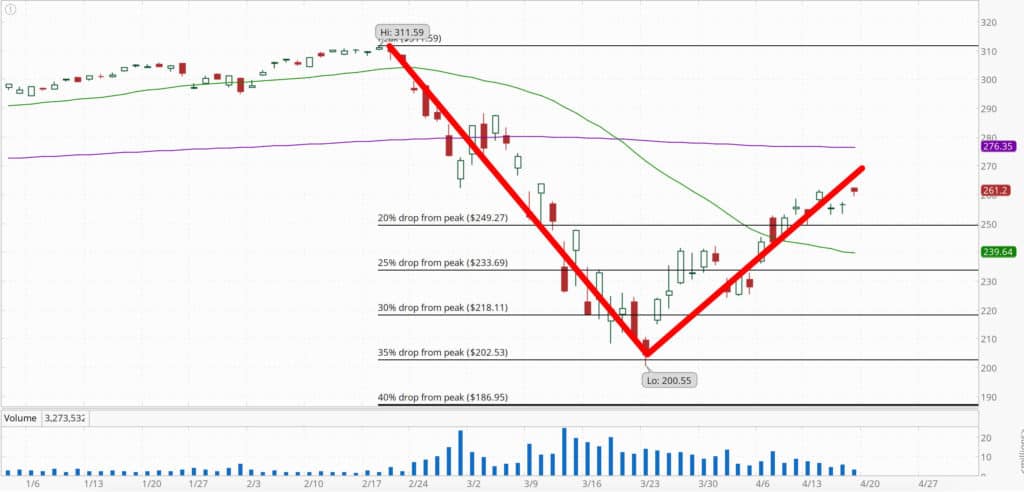
A popular theory is that this rapid selloff and equally rapid rebound is a V-shaped recovery.
As of writing the Vanguard S&P 500 VOO ETF fell over 35% from 311.59 down to 200.55 before rallying back 30% up to 261.2
While this certainly is the case right now, I believe that the fallout from COVID-19 will continue for many months and US stocks will make new lows. We’ll see which organizations and governments have been swimming naked as the tide is going out and the results will probably be ugly.
The COVID-19 pandemic is a great tragedy and an unprecedented event in modern history. In the midst of countless negatives–one positive is this market selloff presents a buying opportunity.
As someone who has been overweight cash over the past few years I’ve been looking a selloff like this to be able to increase my exposure to the markets.
I can’t predict when the market will bottom or I would just buy in then. So I want to go over three strategies one could use to enter this market.
COVID-19 case Plateau
It is possible that when the number of active COVID-19 cases plateau that will also be around the time the market bottoms out.
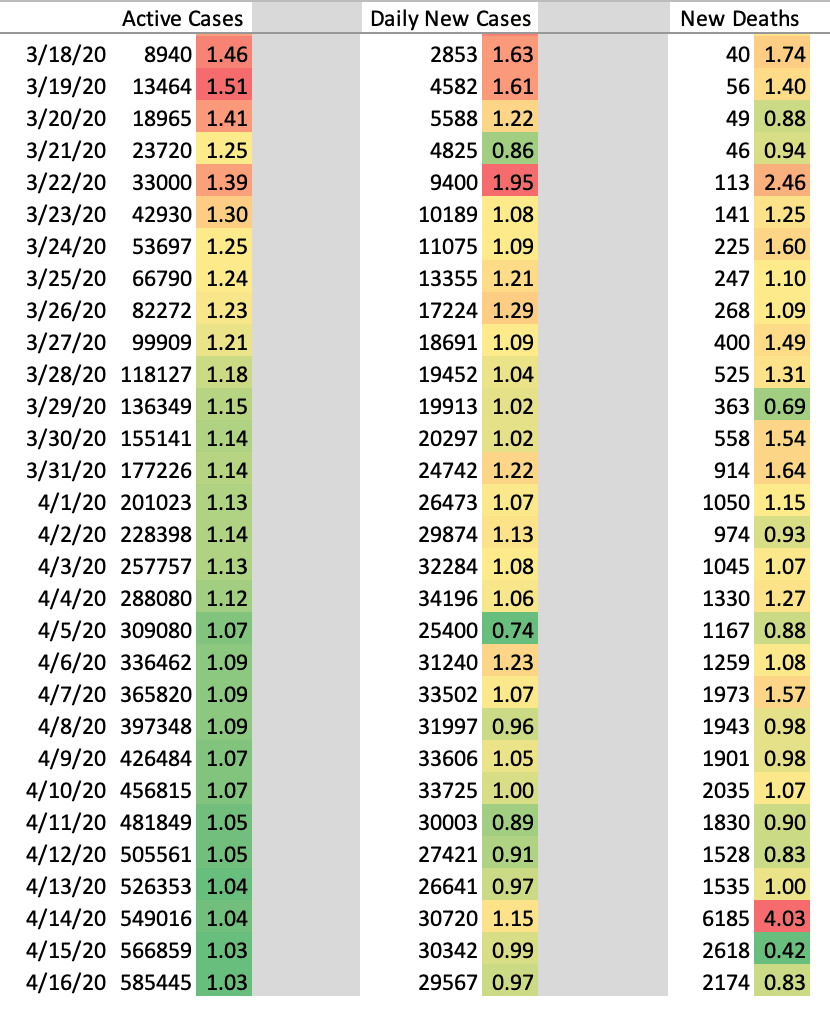
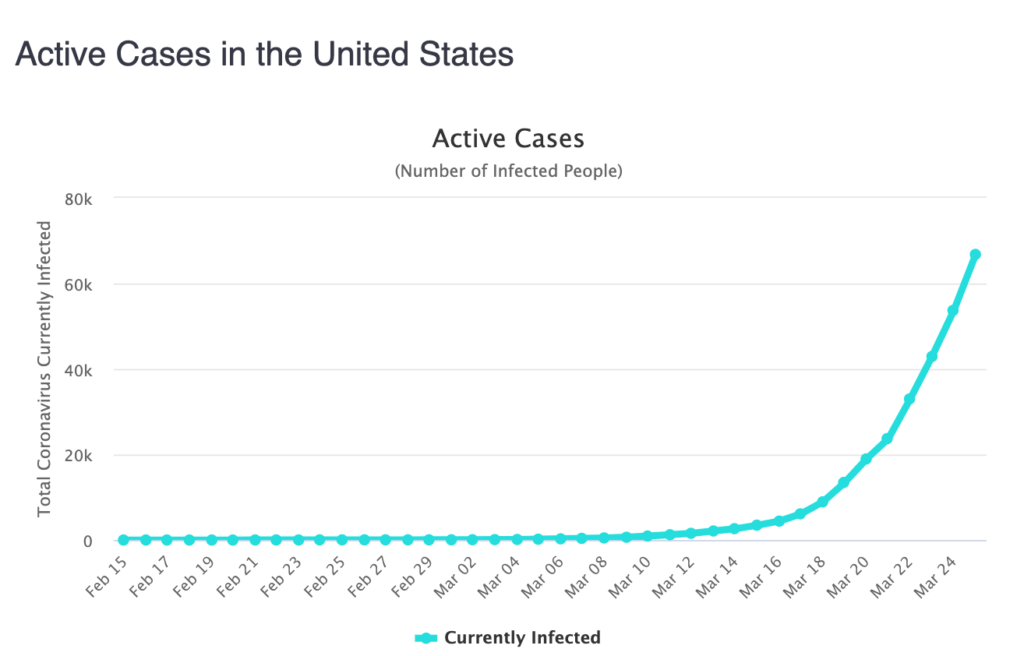
Active Cases in the US continue to climb
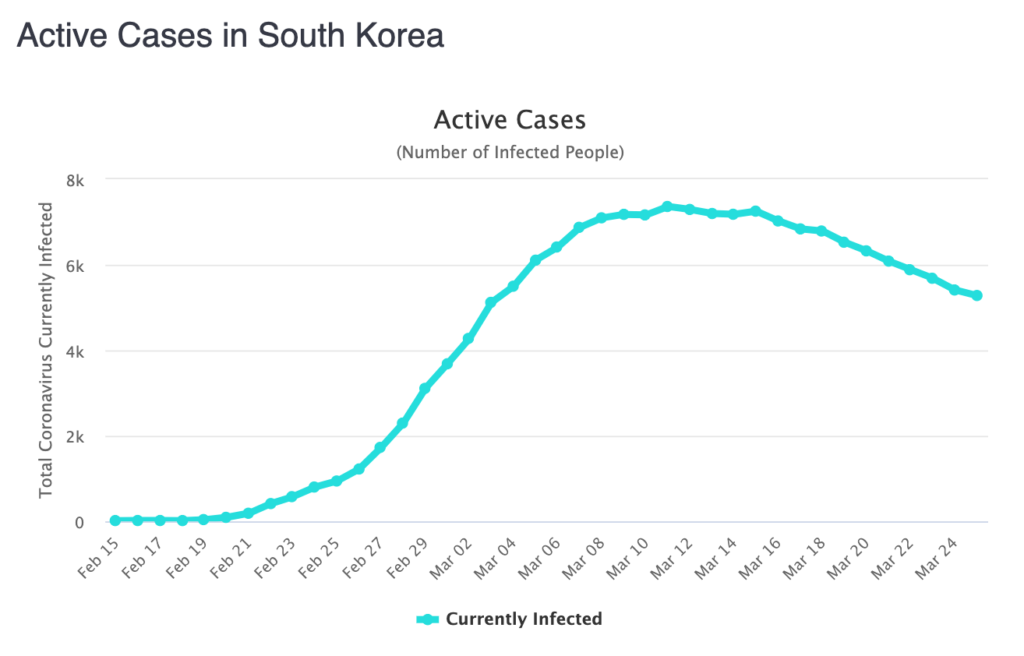
As of now the active cases in the US have continued to climb. At some point this will plateau, as it already has in places like South Korea.
Active Cases in South Korea Plateaued in mid-March
Modified Dollar Cost Averaging
This method attempts to capture market exposure at given price levels.
To do this, first determine how much you’re planning on investing. Then break than into a series of price levels. For example, if you’re planning on investing $3,000 at three different price levels, you’d be investing $1,000 per price level.
Price levels could be something like the % fall from the prior peaks drop. So when the market falls 30% from peak, you invest $1,000, when it falls 40%, another $1,000 and if it falls 50% the remaining $1,000.
For example, the S&P 500 peaked at 3393 on 19 February. So $1,00 would be invested at the 30% drop level of 2375, a 40% drop would mean buying in at 2036, 50% would be 1696.
The downside to this is that the market might never fall 40% or 50%. If this happens one wouldn’t buy into the market at these levels and money would be left uninvested. It could also of course fall more, in which case one would have bought in at a higher level.
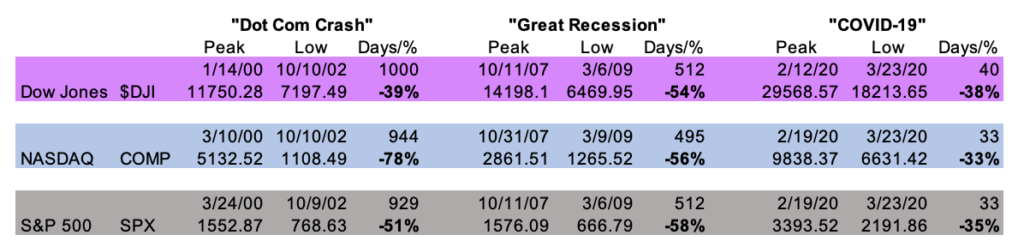
Looking at the previous bear markets of the past 2 decades, the bottom of markets is not made after just a 35% drop in 33 days.
Given that the number of COVID-19 cases in the US continues to climb I don’t believe the market has bottomed yet. The market has rallied about 14% off of the 23 March lows, but I believe the market will give up these gains and make a new low.
Of course I can’t know for sure.
Good Old Dollar Cost Averaging
This is probably the simplest and most basic method. This is buying a set dollar amount of shares on a set schedule. Such as $100 on the first of each month. When prices are lower, more shares will be purchased and when prices are higher, fewer shares will naturally be purchased.
The downside to this method is that if one has any reasonable belief that the market will fall more, then one is buying in at a higher price than is necessary.
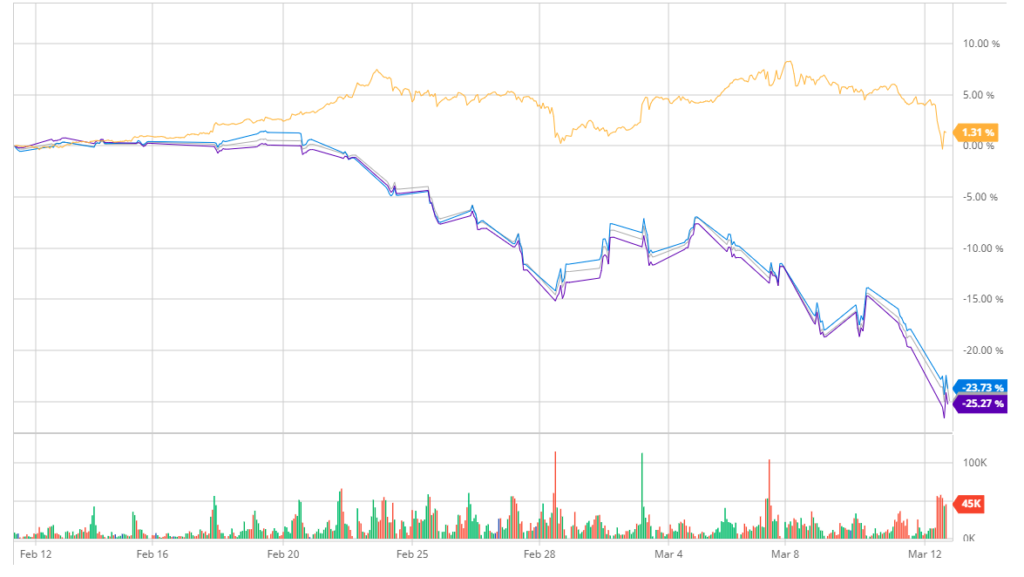
Despite the rally over the past few days, major US indices like the S&P 500 are still down some 23% from the 19 February high.
Of course it’s impossible to know with certainty.
COVID-19 Selloff Buying Opportunity
Gold has been a decent hedge thus far. Gold is up 3% since the 19 February high compared to the S&P 500 which is currently down over 27%.
In the 2000 dot com crash markets didn’t bottom for for nearly two and half years. The 2007-2008 great recession market drop took about 500 days. We are less than 2 months into this crash.
We are certainly living in interesting times. While this has been a sharp and violent selloff, it presents a buying opportunity, if not now at some point over the next few months or years. I personally think the markets will fall lower, perhaps to the 40-50% level before beginning to climb again.
Since early 2009 US markets have been in a bull market. In less than a month that 11 year bull market has ended and we are now officially in a bear market. The big three US indices are all down more than 20%.
NASDAQ in blue, S&P 500 in Grey, Dow Jones Industrial Average in Purple and Gold in Yellow
Interesting that the trigger to the selloff was something no one was expecting. But perhaps the fact that no one saw this specific catalyst coming shouldn’t come as a surprise.
As I mentioned before, making financial decisions out of fear or panic will rarely result in the best outcome. Cool heads will prevail.
At this point in time I have more questions than answers, but in the midst of this bear market there is great opportunity.
Is Now the Time to be “Greedy”?
“Be fearful when others are greedy and greedy when others are fearful.” – Warren Buffett
It’s hard for me to respect Warren Buffett when the man does everything in his power to avoid paying taxes while at the same time publicly saying he should pay higher taxes. It is hypocritical.
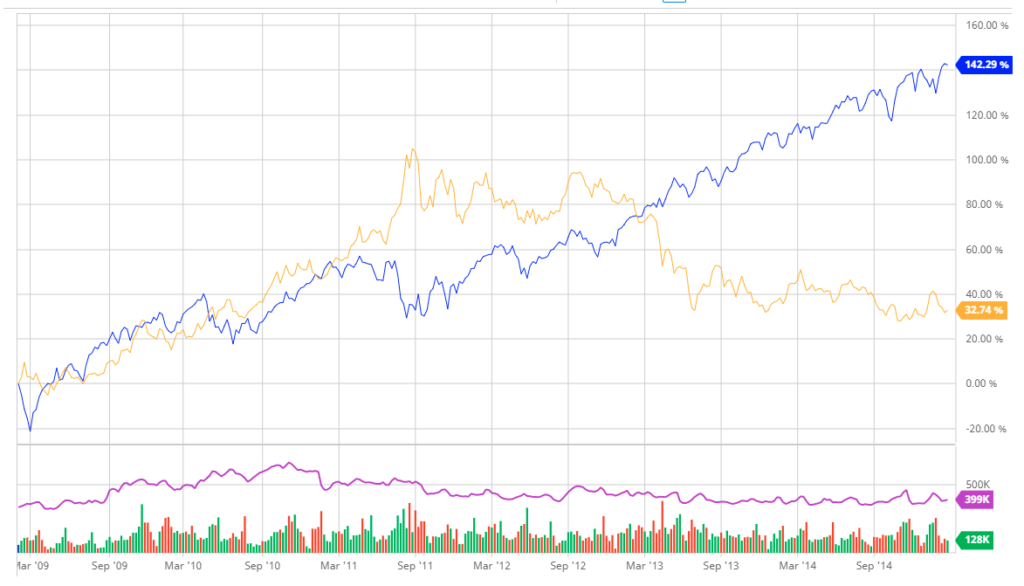
Despite my misgivings about Mr. Buffett I can’t argue with the long term performance of Berkshire Hathaway.
It’s important to ignore what Warren Buffet says on his virtue signaling tours and look at what he is actually doing with his money.
Others are fearful right now so it could be a good time to be “greedy”. Of course buying things on sale isn’t actual greed but I digress.
Who Knows when the markets will bottom out?
I’ve been underweight US stocks and will be using this bear market as an opportunity to dollar cost average into US index funds and ETFs. I do not believe it is possible to time the bottom so I’m not going to try. What I am trying to do is to buy into the market at an interval of good prices.
Compared to the highs stocks are on sale at a 25% discount. They might go on sale for 40% off or even 50% off but in either case it is a significant discount from the mid-February highs.
How is Gold Working Out?
Gold has been a decent hedge so far. However during a panic the yellow metal will probably fall as people sell everything. And indeed gold is down from the $1,700 high made earlier this month.
For the first five years after the last financial shock (2008-2009) US stocks were the place to be and gold, which had a tremendous run-up, went into a bear market. Of course past performance is no guarantee of future performance, but it can provide a guide for how markets could possibly perform.
Gold in Yellow and S&P 500 in Blue
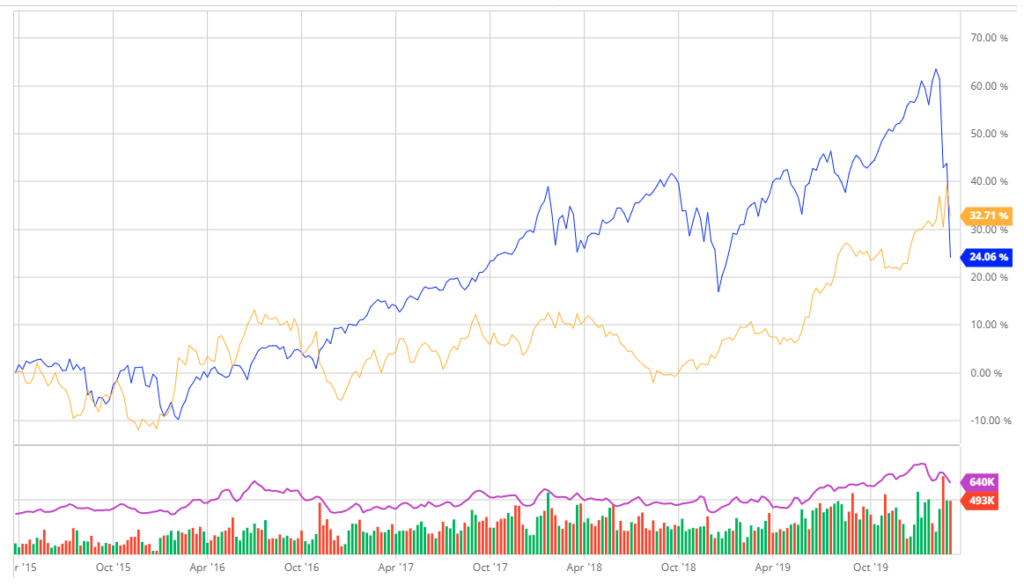
Over the past five years, as a result the current crash, gold has outperformed the S&P 500. Gold is up 32.71% compared to the S&P 500 being up 24.06%.
Gold in Yellow and S&P 500 in Blue
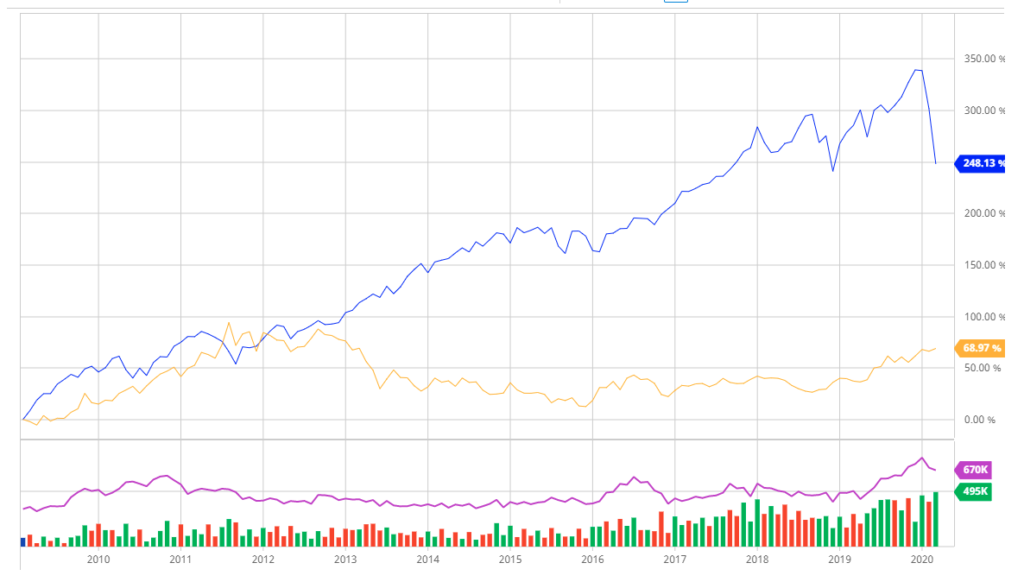
However, even after this large drop. Since the 2008-2009 financial crisis, stocks have been the place to be. The S&P 500 is still up 248% since February of 2009, while gold is up relatively modest 68.9%.
Gold in Yellow and S&P 500 in Blue
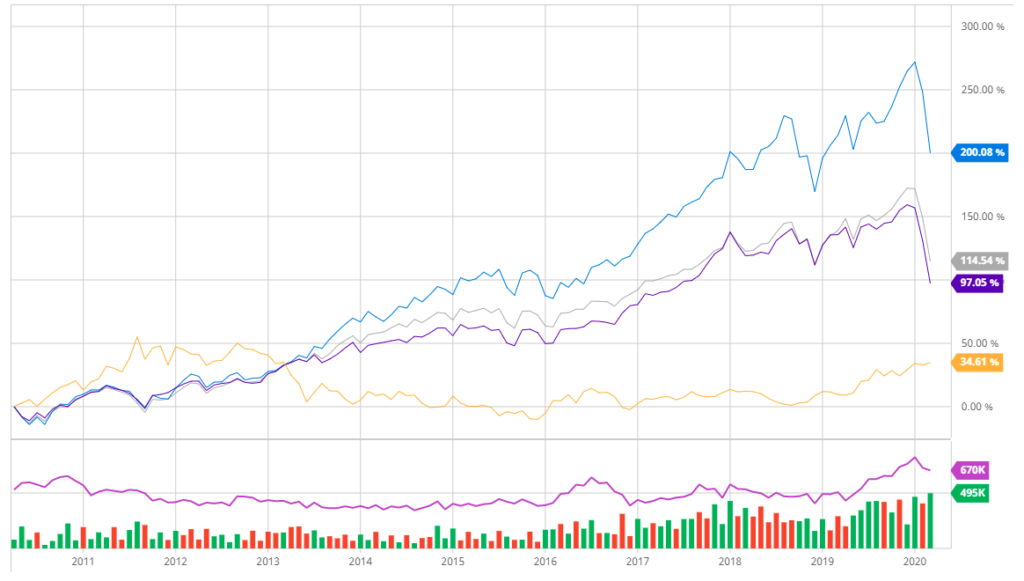
And despite this large drop, for the past 10 years, stocks have done very well.
NASDAQ in blue, S&P 500 in Grey, Dow Jones Industrial Average in Purple and Gold in Yellow
The Fed Tries to “Help”
Not one to stand by and allow the free market to operate–the US Federal Reserve announced more quantitative easing (QE4) on Thursday. Of course if you count the not-QE QE, this would be QE5, for those keeping score at home. It is also anticipated that rates will be cut again.
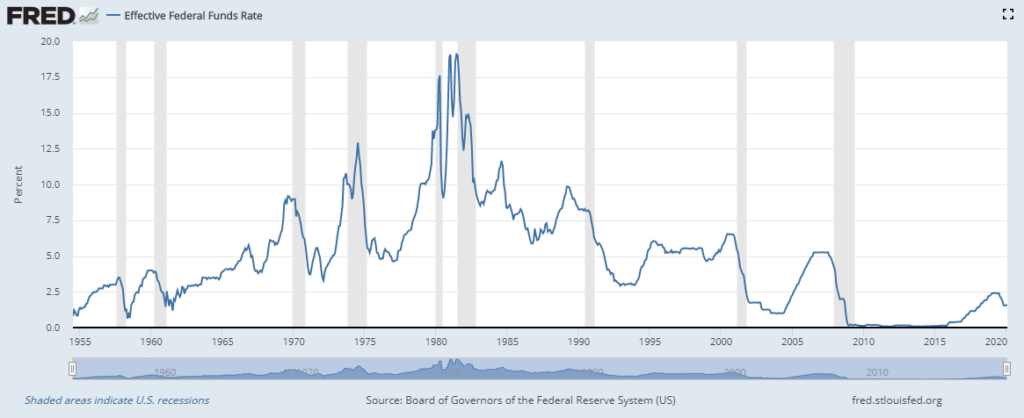
Rates were over 6.5% prior to the 2000 dot com crash. They were hiked back up to about 5.25% prior to the 2008-2009 financial crisis. But after the 11 year bull run rates only made it as high as 2.4%.
In short the rates have never been this low going into what could be a recession.
The Fed is entering this bear market (and potential recession) with interest rates already so low they have little ammunition to “help”.
The Fed is already doing more Quantitative Easing.It seems inevitable that rates will go negative.
The Coronavirus (COVID-19) outbreak has tanked stocks. The S&P 500 is down 13.6% into correction territory, falling from the high of 3,397.5 down to 2,931 as of writing this article. Other major indices have fared similarly.
What we Know about the Coronavirus
“As of March 6, 98,134 people have been confirmed to have COVID-19 (also known as the Wuhan coronavirus)…There have been 3,388 fatalities. “
As is often the case, the COVID-19 virus seems to impact the elderly more severely. As of 11 Feb, in mainland China, no deaths occurred in those age 9 or younger. The fatality rate was estimated to be higher among those age 70 and older.
By comparison, in the 1918 “Spanish Flu” epidemic the case fatality rate was estimated to be 2-3%.
I think it is valuable to keep this in perspective by comparing it the the standard influenza virus or “flu”. So far in the 2019-2020 flu season in the United States, there have been between 32 to 45 million flu illnesses and 18,000-46,000 flu deaths. By my calculation this would be a case fatality rate between 0.04%-0.14%.
The case-fatality rate is the number of confirmed cases divided by the number of confirmed deaths.
Of course there will likely be many more people who have or had COVID-19 that were never confirmed cases. A healthy person with flu-like symptoms might never go to the doctor and get tested and recover on their own. It is also possible there are people who have had COVID-19 that never showed symptoms and they would not count towards the number of people who have been infected.
In my opinion the number of confirmed deaths of Coronavirus is likely to be more accurate than the number of people infected. If someone dies of flu-like symptoms they were probably hospitalized before they died and were tested.
The point is there are a lot of unknowns. The stock market doesn’t like unknowns. At this point we don’t know if COVID-19 will become an epidemic or not.
What this Means for Your Wealth
I confirm from personal experience that making financial (or any other decisions) from a position of fear, panic or anxiety will almost never result in a good outcome.
While it can be easy to invest heavily in stocks or other higher risk assets when times are good, a 13% correction is a good reminder of the importance of diversification into a variety of non-correlated asset classes.
Even though gold has under performed stocks since the 2008-2009 financial crisis, the yellow metal has done well in the face of the Coronavirus panic.
Psychologically I think it is easier to keep calm and not panic when some assets are going up, as opposed to when all your holdings are dropping in value.
I have actually been underweight US stocks, missing out on some gains over the past 10 years, and will attempt to use this selloff to carefully and slowly build more equity exposure, cognoscente that stocks could always fall lower, particularly as the US enters election season and the uncertainly and volatility that could produce.
While I think that gold probably will go higher, with it trading at a six plus year high, it could be a good time for some profit taking for those over-allocated.
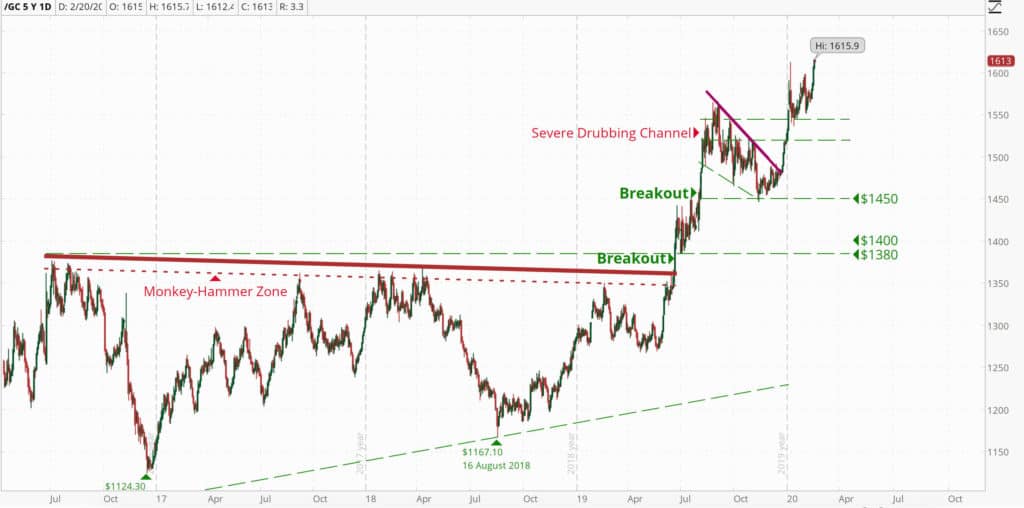
Gold reclaimed the $1,500 level just a couple months ago over Christmas. Now the yellow metal has topped $1,600 and is trading north of $1,610. Gold also reached this level earlier this year on January 8. However, long term Gold has not been at this level since March of 2013.
With a US stock market that is 11 years in a bull market, profligate government spending, artificially low interest rates and geopolitical uncertainty in Iran and China, gold will likely remain a safe haven place to park capital.
However, for those over allocated gold, this is also an opportunity for some profit taking.
This website uses cookies to improve your experience. We'll assume you're ok with this, but you can opt-out if you wish.AcceptRejectRead More
Cookie Policy
Privacy Overview
This website uses cookies to improve your experience while you navigate through the website. Out of these, the cookies that are categorized as necessary are stored on your browser as they are essential for the working of basic functionalities of the website. We also use third-party cookies that help us analyze and understand how you use this website. These cookies will be stored in your browser only with your consent. You also have the option to opt-out of these cookies. But opting out of some of these cookies may affect your browsing experience.
Necessary cookies are absolutely essential for the website to function properly. This category only includes cookies that ensures basic functionalities and security features of the website. These cookies do not store any personal information.
Any cookies that may not be particularly necessary for the website to function and is used specifically to collect user personal data via analytics, ads, other embedded contents are termed as non-necessary cookies. It is mandatory to procure user consent prior to running these cookies on your website.