by John | Feb 11, 2018 | Economic Outlook, Geopolitical Risk Protection, The Stock Market, Wealth Protection
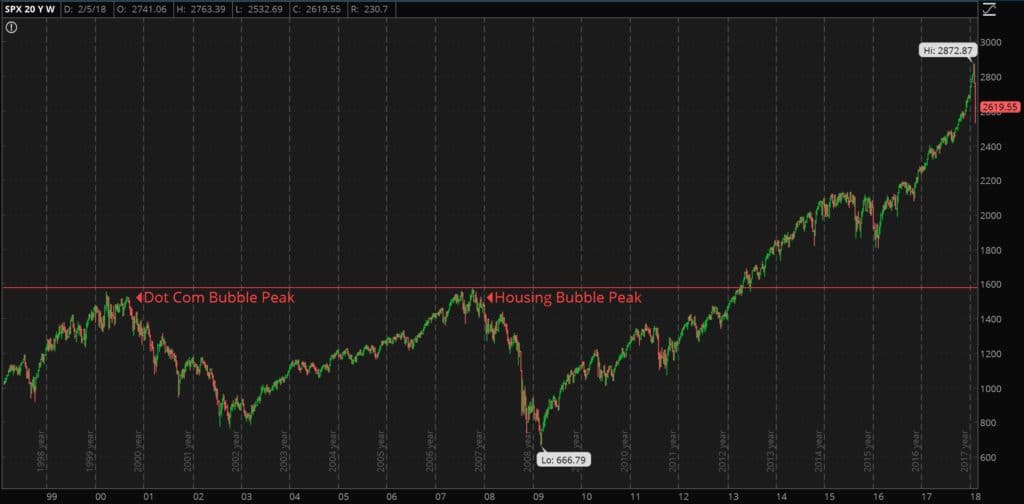
Despite the pullback over the past few trading days, the S&P 500 is still far beyond the highs during the dot-com bubble and subsequent bust as well as the housing bubble and subsequent great recession.
If the fundamentals supported the S&P 500 at these elevated prices it would be great but the fundamentals do not…these elevated stock prices are one of the faulty wirings running through the global economy.
Up until the last few trading days, using the Shiller PE ratio*, there has only been one time in the history of the S&P 500 when the Price to Earnings level was higher, and that is the peak of the dot-com bubble.
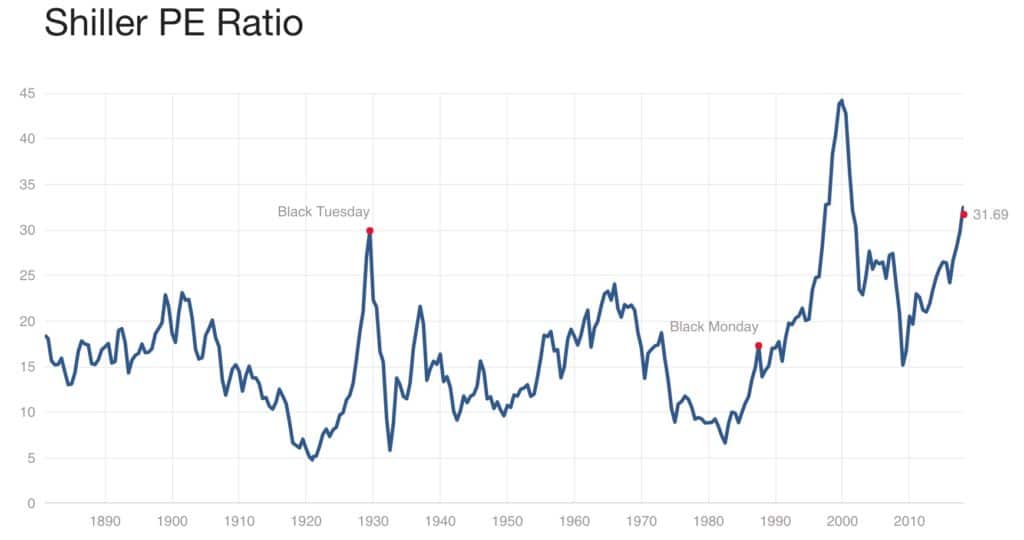
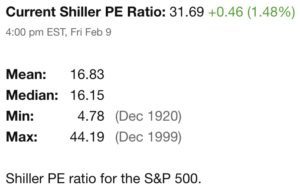 *Price earnings ratio is based on average inflation-adjusted earnings from the previous 10 years, known as the Cyclically Adjusted PE Ratio (CAPE Ratio), Shiller PE Ratio, or PE 10
Source: http://www.multpl.com/shiller-pe/
While imperfect (I tried in vain to find a Price to Free Cashflow chart for the S&P 500), the price to earnings ratio is essentially how much a stock (or in this case the S&P 500 index) costs relative to it’s earnings. A lower PE is better because it means you are paying less for a stream of income.
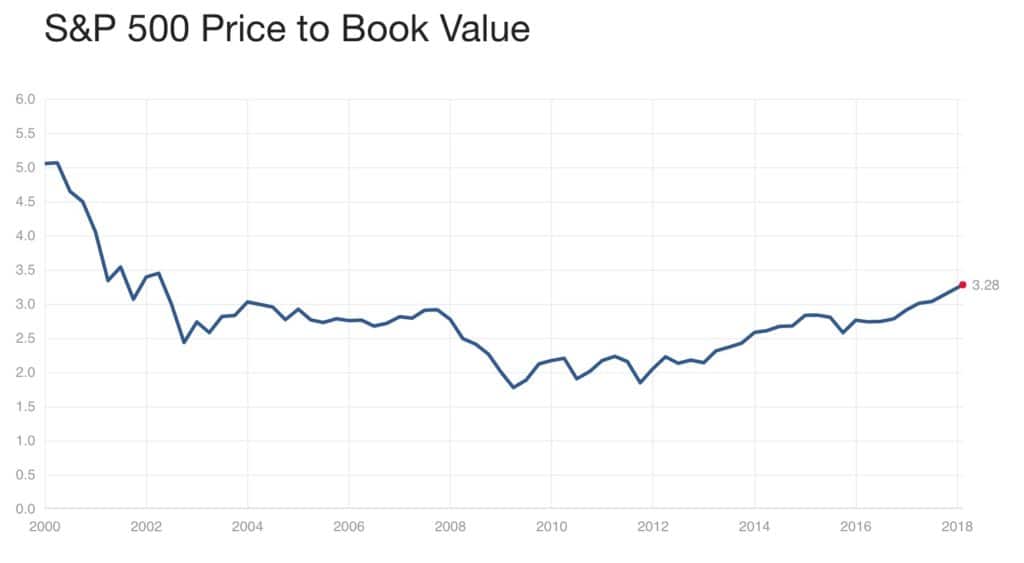
Price to book is another metric we can look at and the price to book ratio of the S&P 500 is at a level not seen since the 2008 financial crisis.
Source: http://www.multpl.com/s-p-500-price-to-book
Netflix: A Specific Example
I want to pick on Netflix as an example of an overvalued stock.
One of the most important metrics for evaluating a company is free cash flow. Earnings can be a little suspect because of accounting gimmicky but it is tough to hide free cash flow numbers. It’s one of my value investing metrics.
Netflix (NFLX) has not had positive free cash flow since twenty-thirteen. In 2016 the free cash flow was in excess of negative $1.5 billion and the trailing twelve month free cash flow amounts to over negative $2 billion.
Source: http://financials.morningstar.com/cash-flow/cf.html?t=NFLX®ion=usa&culture=en-US
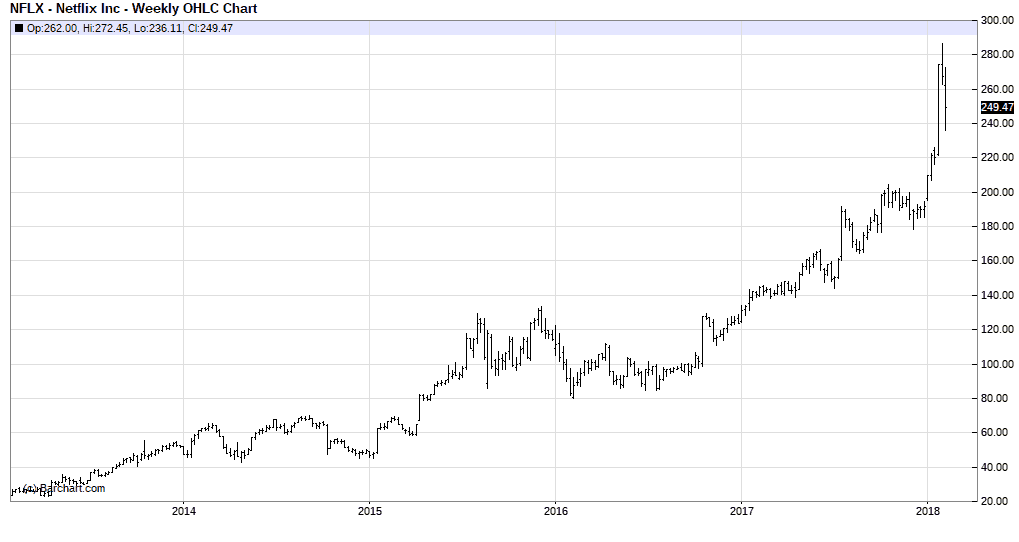
So they are bleeding money and yet as you can see from the chart above, apart from this last week Netflix stock continues to climb.
What is Causing the Stock Market to Rise?
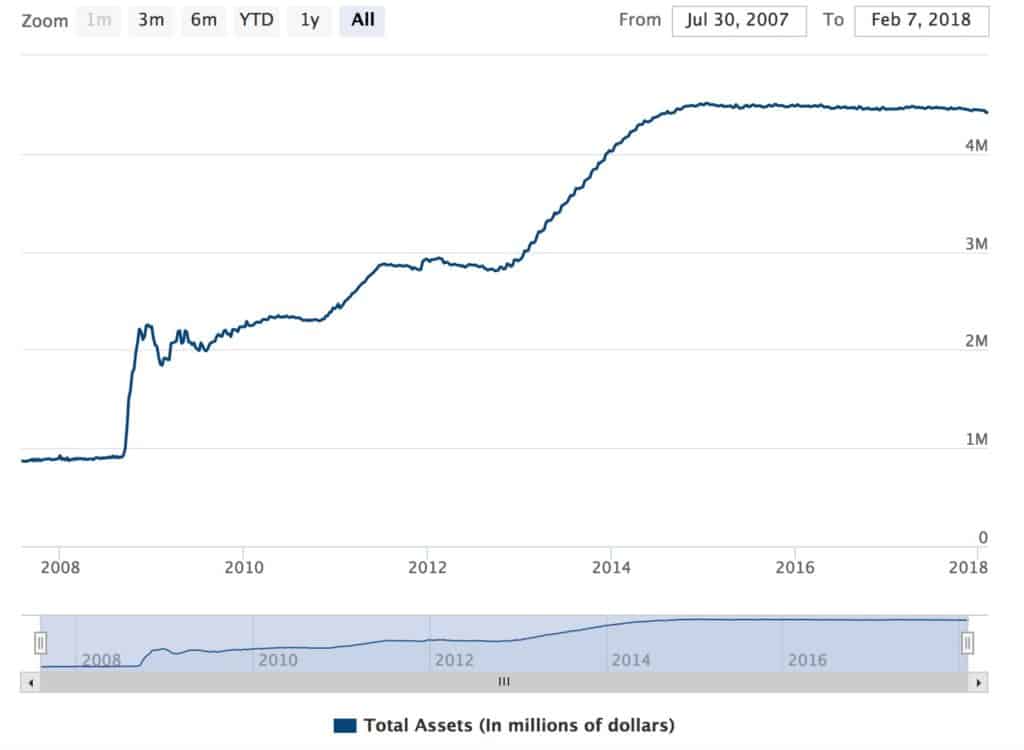
The United States Federal Reserve has bought bonds to lower interest rates and has also bought other toxic assets (like mortgage backed securities “backed” by mortgages that had defaulted).
In the wake of the 2008 financial crisis the Federal Reserve balance sheet has swollen to over $4 trillion. The chart below shows the Fed’s balance sheet in millions of millions (aka trillion).
Source: https://www.federalreserve.gov/monetarypolicy/bst_recenttrends.htm
This has driven down bond yields and driven up bond prices.
This makes it cheaper to borrow money to buy stocks. It also forces income focused investors to forsake bonds (which have little to negative real yield) and instead pour money into dividend paying stocks.
Companies can also issue bonds at lower rates, and use the proceeds to buy back their own stock.
Source: https://www.wsj.com/articles/companies-stock-buybacks-help-buoy-the-market-1410823441
Source: https://www.reuters.com/investigates/special-report/usa-buybacks-cannibalized/
Source: https://www.wsj.com/articles/buybacks-pump-up-stock-rally-1468363826
The Stock Market is Overvalued
Stocks are overvalued and as bubbly as can be due to reckless US Federal Reserve monetary policy. Last Thursday the 8th the stock market closed in correction territory. It rallied back Friday.
I don’t know if this is the start of a larger selloff into a full on bear market or if this will be contained to a correction.
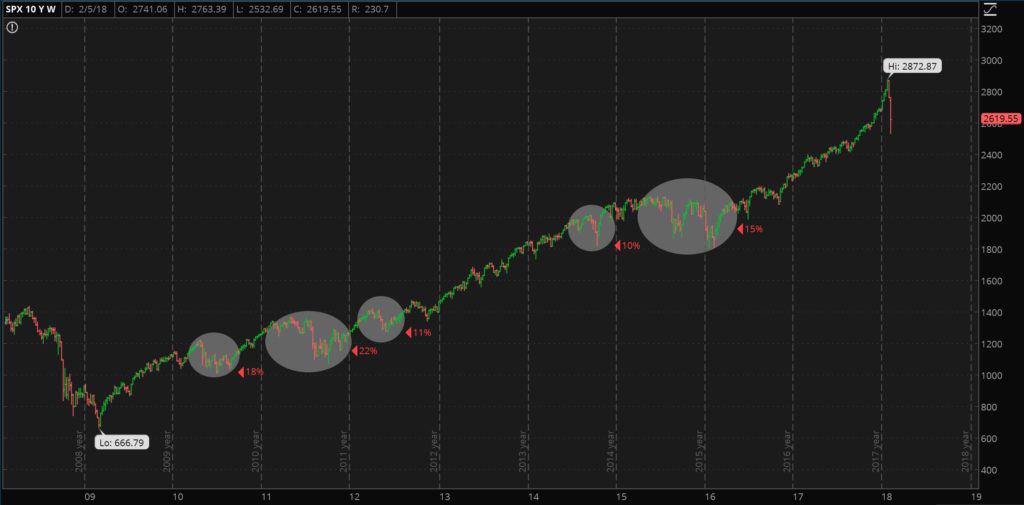
Since the lows of the 2008-2009 financial crisis there have been several corrections and even a 22% drop in 2011. Those were in an ultra accommodative monetary environment and not in a tightening cycle.
This probably *should* be the start of a bear market but the bulls and the Fed might be able to bid the market back up as they have several times before.
I don’t recommend trying to short the market or (if you own stocks) sell. If you know how to time the market I want to get advice from you because I don’t know how to time the markets.
I do know that stocks are overvalued and due for a correction. If the Fed does step in to prop up the markets it will be more negative news for the dollar. The Fed also doesn’t have much room to cut rates and would either have to sit by and do nothing (unlikely) or restart quantitative easing and negative rates.
This should be positive for foreign value stocks and precious metals. From the lows in 2009 the S&P 500 is up 293%. Even if you bought the S&P 500 at the peak of the 2008-2009 bubble you’d be up 80%. The dollar hasn’t tanked so dollar denominated stocks have been a winner. However, if prices and fundamentals mean something, eventually stocks will correct or the dollar will implode. When that happens it will be critical to your financial survival to have alternative investments in place.
This is part 4 of 5 of what I’ve decided to term The Economic Conflagration series where I discuss the faulty wiring pervasive the global economy:
Part 1: A Deadly Electrical Fire you Need to Know About
Part 2: The Real Economy is Weak
Part 3: Crushing Debt in the United States Limits Economic Growth
Part 4: Stocks are Overpriced and Due for a Significant Crash
Part 5: What you can do about it
Part 5 will be release in the coming weeks. Subscribe below to ensure you don’t miss it.

by John | Aug 7, 2016 | Geopolitical Risk Protection, Wealth Protection
I’m going on record: US Stocks and Bonds are in a Bubble
What is a ‘Bubble’?
A bubble is an economic cycle characterized by rapid escalation of asset prices followed by a contraction. It is created by a surge in asset prices unwarranted by the fundamentals of the asset and driven by exuberant market behavior. When no more investors are willing to buy at the elevated price, a massive selloff occurs, causing the bubble to deflate.
Source: Investopedia
In recent history, there was the “dot-com” bubble which burst in 2000 then the housing bubble which popped in 2008. I think we’re close to a third bubble imploding.
I don’t think this is very controversial or insightful but I don’t hear many people talking about it.
Sometimes an insight is just stating the obvious when no one else will.
Now I can’t take credit for this prediction. My views have been formed by folks like Peter Schiff, Simon Black and others who have been making this prediction for years. But I want to get the word out to anyone in my audience not familiar with these figures.
By way of some background, lets take a look at how US stocks and bonds in general have performed.
How have US Stocks Performed?
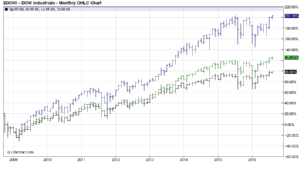
Since 2000, the Down Jones Industrial Average is up nearly 68%, the S&P 500 is up 55% and the NASDAQ is up just shy of 31%.
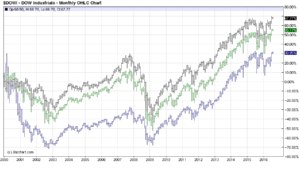
Since 2008, the Down Jones Industrial Average is up over 98%, the S&P 500 is up 125% and the NASDAQ is up 203%.
Source: barcharts.com
How have Bonds Performed?
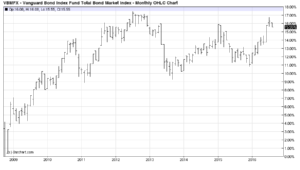
Using the Vanguard Total Bond Market Index Fund (VBMFX) as a proxy for the total bond market, we can see since 2000 Vanguard’s bond fund is up 11%.
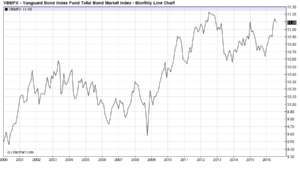
In the depths of the housing crisis in 2008, this fund was trading around 9.58. The index is now trading at 11.08.
That is a modest 15% return spread over 7.5 plus years.
Source: barcharts.com
Who inflated this Bubble?
The reason bonds and stocks have gone up in value since the 2008 crash is because the United States Federal Reserve “The Fed” has done three rounds of quantitative easing (where they go out and buy bonds including US treasury securities as well as mortgage backed securities, etc. on the open market) and the Fed continues to reinvest in bonds when they mature. The Fed balance sheet is now over $4.4 trillion.
Source: https://www.federalreserve.gov/monetarypolicy/bst_recenttrends.htm
So like the last two financial crises the bubbles have been inflated by the US Federal Reserve.
According to the Bank of International Settlements, as of Q4 2015 the total outstanding US government debt securities amounted to about $16.2 trillion.
Source: http://www.bis.org/statistics/c3-us.pdf
Of the Fed’s $4.4 trillion balance sheet about $2.5 trillion is treasury securities.
Source: https://www.federalreserve.gov/monetarypolicy/files/quarterly-report-20160331.pdf
The US Fed owns about 15% of US government treasury securities. So by gobbling up 15% of all US treasuries, the US Federal Reserve has inflated the bond bubble and causes bond prices to rise.
By lowering the so called “risk free” rate of return of government debt, investors and speculators have piled more money into the stock market in search for yield. Additionally, any entities who trade on margin, thanks to the lower rates, can borrow and speculate with more money at near zero cost.
It isn’t just the US Fed—central banks around the globe have taken unprecedented action to lower interest rates and buy government debt.
In fact the Swiss national bank holds $62 billion in US stocks.
Source: http://www.zerohedge.com/news/2016-08-04/mystery-buyer-revealed-swiss-national-banks-us-stock-holdings-rose-50-first-half-rec
The fundamentals of US government debt instruments have never been worse
Buyers of US government debt are making unbacked loans to a government already $19 trillion in debt with tens of trillions more in unfunded liabilities.
US Government debt pays no real yield
A 10-year Treasury pays just over 1.5% interest. 1.5% over 10 years. The government’s own numbers say that price inflation is at 1% per year.
Source: http://www.bls.gov/cpi/cpid1606.pdf
Source: http://www.multpl.com/10-year-treasury-rate/table/by-year
This means that even if you take the government numbers at face value you are guaranteed to lose purchasing power. The only way not to lose money on these bonds is if someone else buys them at a higher price.
Now I think prices are rising faster than 1-2%. I think prices are easily rising at 3-5% per year–maybe higher.
The fundamentals of the US stock market are not stellar either.
Corporations have been issuing bonds and using the money they bring from the bonds to finance share buy backs. They also use non-standard accounting tricks to look more profitable than they actual are.
Source: http://www.marketwatch.com/story/us-companies-spent-record-amount-on-buybacks-over-past-12-months-2016-06-22
Corporate profits have started declining since 2014, labor force participation is at multi-year lows.
Source: http://data.bls.gov/
Source: http://www.tradingeconomics.com/united-states/corporate-profits
Stock prices have gone up in anticipation of a recovery not because of one.
Now despite these potentially troubling trends I’m not worried. Why?
I Don’t Own (Many) Bonds
I don’t own hardly any bonds. One of the mutual funds I own is 36% bonds, which amounts to less than $2,000 bond exposure. But that is it.
If bonds are extremely overvalued, as I believe they are, that means my exposure to this bubble is limited.
Now just because I don’t own many bonds doesn’t mean I’m protected. If the bond bubble were to pop and the value of bonds were to plummet this would cause a panic and asset prices of stocks and other assets would likely crash as well.
I don’t think that is going to happen.
Federal Reserve will buy as money bonds (and other securities) as it takes to keep a collapse from happening. We’ve already seen this in countries like Japan, where the Bank of Japan owns 33% of the Japanese bond market and about 55% of Japan’s ETFs.
Source: http://www.bloomberg.com/news/articles/2016-04-24/the-tokyo-whale-is-quietly-buying-up-huge-stakes-in-japan-inc
Source: https://mishtalk.com/2016/04/21/bank-of-japan-corners-33-of-bond-market-all-japanese-bonds-40-years-and-below-yield-0-3-or-less/
The Yen has been destroyed by the BOJ. The Federal Reserve has already done a lot of damage to the value of the dollar but could still do a lot more damage.
I believe that the Federal Reserve will destroy the purchasing power of dollars in order to prop up government bonds and stocks. So people who own bonds and stocks will do okay, but savers and individuals on a fixed salary will be impoverished.
“But I’ve Made a lot of Money in Stocks!”
Oh you have?
It’s true the US stock market has been on a great bull ride since the 2008 lows.
If I had to buy US stocks and I had a crystal ball I would have sold all my stocks in October 2007 before the housing crisis, bought back in at the lows in March of 2009 and then I would sell at the market top (if we haven’t already passed it).
However, I haven’t been able to figure out how to time the market.
I don’t think I can just take the approach of selling when the market starts to tank.
Because I don’t think I am going to be fast enough to be able to sell if people start dumping stocks.
If everyone heads for the exists at the same time not everyone can get out at the same time. If everyone sells stocks at the same time they not everyone can sell at the same price.
Plus if everyone is selling who is going to buy?
When the stock and bond market bubbles are pricked the bubbles could deflate rapidly before the US Federal Reserve and government step in to try to stop the bleeding.
I’ve been in situations in the last two years when there was significant market volatility and I could not even login to my broker platform.
Even if I can login to sell stocks brokers and exchanges could halt trading to try to limit the panic (which would probably cause more panic).
In order to actually keep the stock market from crashing the Fed is going to have to create so many dollars that most of the rise (or failure to fall) of nominal stock prices will be offset by price inflation.
I think I’ll be better off outside of the US stock market and dollars.
That’s why I’ve been an investor and advocate for physical gold and silver, Goldmoney (formerly BitGold), foreign stocks, and yes even bitcoin, although the recent volatility and hacks further demonstrate the risk in bitcoin.
You won’t hear too much about these alternative investments from mainstream sources, unless it is to deride them.
These investments are risky, and frankly I can’t advise anyone to own any of these asset classes. They might not be suitable for you.
But I see the risk in US stocks, bonds, and dollars as much greater and so I’ve chosen to diversify into alternative investments.
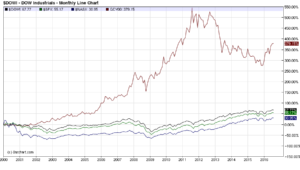
And while past performance is no guarantee of future performance this chart shows that gold (shown in Dark red) has already been doing quite well against US stocks, being up 379% since 2000.


 *Price earnings ratio is based on average inflation-adjusted earnings from the previous 10 years, known as the Cyclically Adjusted PE Ratio (CAPE Ratio), Shiller PE Ratio, or PE 10


