
Gold is a bellwether for the health and safety of the financial system. When gold is rising in price, it indicates investor’s lack of confidence in fiat currency and the stocks, bonds and other securities priced in said fiat currency.
Gold Price Monkey-Hammering
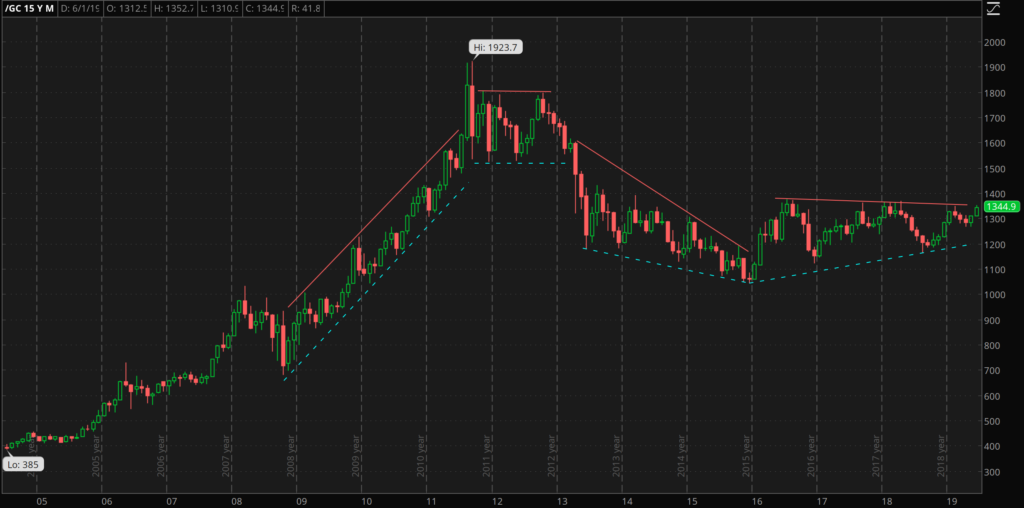
Over the past five years whenever gold trades up to the $1,350-$1,380 range it gets monkey-hammered back down.
Today the price of gold reentered the monkey-hammer zone. I would be pleasantly surprised if gold could breech $1,360 and remain there or higher but if not I think it’s likely to drop down to the $1,230-$1,240 range.
The gold-bug optimist would argue the 8 day winning streak gold has, combined with the prospect of future rate cuts and tariff uncertainty are bullish for gold.
However, if the past 8 years are any indication, rate cuts plus a lack of measured price inflation means buy stocks.
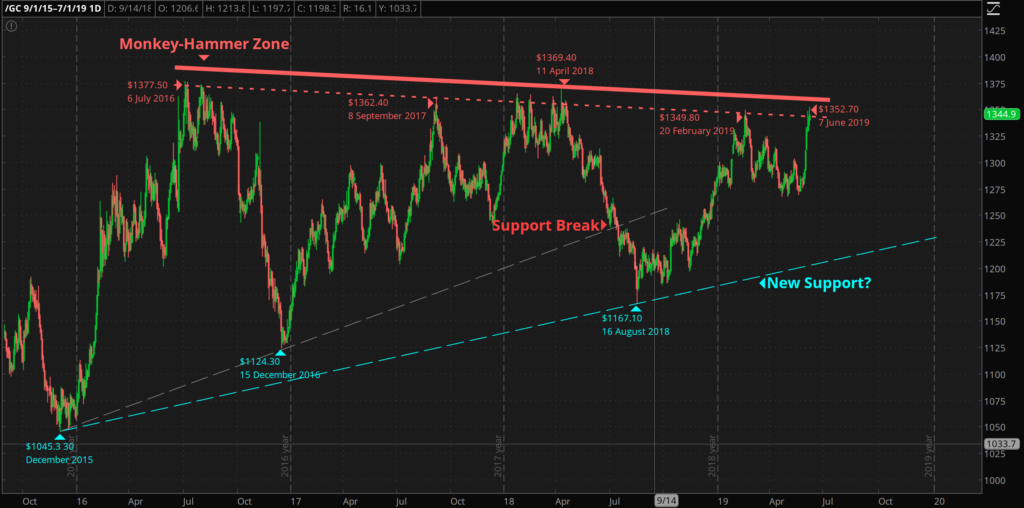
We can see from the chart above that over the past three years there are not a lot of sellers relative to buyers at the $1,050-$1,200 range and that range is trending higher. There still aren’t a lot of buyers when gold gets up to around $1,350-$1,360 and the price drops as a result.
So while the resistance level is falling somewhat, the support level is rising.
I account for the support level rising thusly: gold has performed so poorly relative to stocks for the past 8 years that anyone who was going to sell gold has already sold it and the majority of those that remain are not going to sell.
Furthermore, anyone buying physical gold at this point is planning on holding it for the long term. However, not many investors are adding to their gold holdings, since gold has performed so poorly. The result is gold is fairly rangebound even while the lower bound is rising.
In other words, most all of the weak buyers have been shaken out and only ardent gold bugs remain. The price rises and drops between 1375 and and lows are speculators, short term trend followers and weaker hands.
The Gold Market in 2019 and Beyond
I don’t know, particularly in the short to medium term if gold is going to go up down or sideways. The July 2018 selloff definitely did a fair bit of technical damage and broke down the ascending triangle pattern I had previously written about.
I’m still operating with the belief that gold bottomed in late 2015 and we won’t see $1,045 again. I don’t know what it would take for gold to break out above $1,400 or when that will happen.
If past price action is any indication of future price behavior gold will likely continue to slog along as it has since the December 2015 low until some external catalyst allows it to traverse the monkey-hammer zone and get to $1,400. In the meantime the fiat-bugs continue to win.