by John | Mar 30, 2017 | Value Investing
I’ve been reading How to Value Invest by Jason Rivera and I’m applying what I learn to the value investing metrics I’m use.
The overall principle of value investing remains the same: purchase shares of companies for less than their intrinsic value. I’m simply trying to find the best way to do that.
Some of the additional metrics I’ve been considering at are the EBIT plus cash and cash equivalents / outstanding shares multiples. I’m also looking at the quick ratio and current ratio as ways to measure company solvency as well as net cash per share and insider ownership.
That might sound like a foreign language but I’ll be creating an updated value investing metrics article in the coming weeks that dives into each in more detail.
March Value Stock Picks
FutureFuel (FF on NYSE)
From Google Finance: “FutureFuel Corp. is engaged in the chemical and biofuels business. The FutureFuel Chemical Company, a subsidiary of Company, manufactures chemical products and bio-based products comprising biofuels and bio-based specialty chemical products. The Company operates in two segments: chemicals and biofuels. The chemicals segment manufactures chemical products that are sold to third-party customers. The biofuels segment primarily produces and sells biodiesel to its customers.”
Enterprise Value to Market Capitalization is at .5, EV/FCF is 3.541, and the EV/EBIT ratio is 7.472 (the ratios measure the value of the enterprise relative to free cashflow and earnings before interest and taxes). FF has a yield of 1.72% with a sustainable 18.62% payout ratio. Net Cash per Share is $3.68. The five year average return on equity has been over 5%. A current ratio of 2.814 ensures FutureFuel can service it’s debts. It is a little pricey at around 11 times EBIT plus cash and cash equivalents per share. It is owned over 18% by insiders, which is a good thing.
Enzon Pharmaceuticals Inc. (ENZN on OTC Markets Group)
From Google Finance: “Enzon Pharmaceuticals, Inc. receives royalty revenues from existing licensing arrangements with other companies primarily related to sales of four marketed drug products: PegIntron, Sylatron, Macugen and CIMZIA. The Company has no clinical operations and limited corporate operations. PegIntron is used both as a monotherapy and in combination with REBETOL (ribavirin) capsules for the treatment of chronic hepatitis C. Macugen is used for the treatment of neovascular (wet) age-related macular degeneration. Sylatron is used for the treatment of melanoma. CIMZIA is used for the treatment of moderate to severe rheumatoid arthritis and Crohn’s disease. CIMZIA is a biologic medicine that counteracts tumor necrosis factor (or TNF), which promotes inflammation of the joints in rheumatoid arthritis.”
Enterprise Value to Market Capitalization is at .3, EV/FCF is 1.3 and EV/EBIT ratio is just .52. Net Cash per Share is $.15. The five year average return on equity has been over 5%. Although the trailing twelve month ROE has been negative 6%. A current ratio of 8.4 ensures Enzon can service it’s debts. Even at 5 times EBIT plus cash and cash equivalents it has a a large margin of safety at over 70%.
AmTrust Financial Services (AFSI on NASDAQ)
From Google Finance: “Amtrust Financial Services, Inc. (AmTrust) is an insurance holding company. The Company, through its subsidiaries, provides specialty property and casualty insurance focusing on workers’ compensation and commercial package coverage for small business, specialty risk and extended warranty coverage, and property and casualty coverage for middle market business. Its segments include Small Commercial Business, Specialty Risk and Extended Warranty, and Specialty Program. The Small Commercial Business segment is engaged in providing workers’ compensation, commercial package and other commercial insurance lines produced by wholesale agents, retail agents and brokers in the United States. The Specialty Risk and Extended Warranty segment is engaged in providing coverage for consumer and commercial goods and custom designed coverages. The Specialty Program segment is engaged in writing commercial insurance for defined classes of insureds through general and other wholesale agents.”
Enterprise Value to Market Capitalization is at 1.37, EV/FCF is 3.6 and EV/EBIT ratio is 6.218. AFSI has a yield of 3.44% with a sustainable 22.76% payout ratio. Net Cash per Share is a whopping $45.40. The five year average return on equity has been over 5%. A current ratio of 2.98 ensures AmTrust can service it’s debts. Even at 5 times EBIT plus cash and cash equivalents it has a a large margin of safety at over 75%. It is 16.68% owned by insiders.
I’m planning on opening positions in each of these three securities.
Data is from ycharts.com.
None of this information is a recommendation to buy any security. I’m just sharing some of the value stocks I like.
by John | Mar 5, 2017 | Asset Allocation, Capital Appreciation, Value Investing
Stocks are one of the key ways I grow my wealth.
I like value investing and value stocks. It’s not some aesthetic or subjective reason. As an asset class US value stocks have a history of outperforming other US stock classes.
I like picking individual stocks but I appreciate that is not suitable for everyone. For some folks a passive index asset allocation strategy could be better.
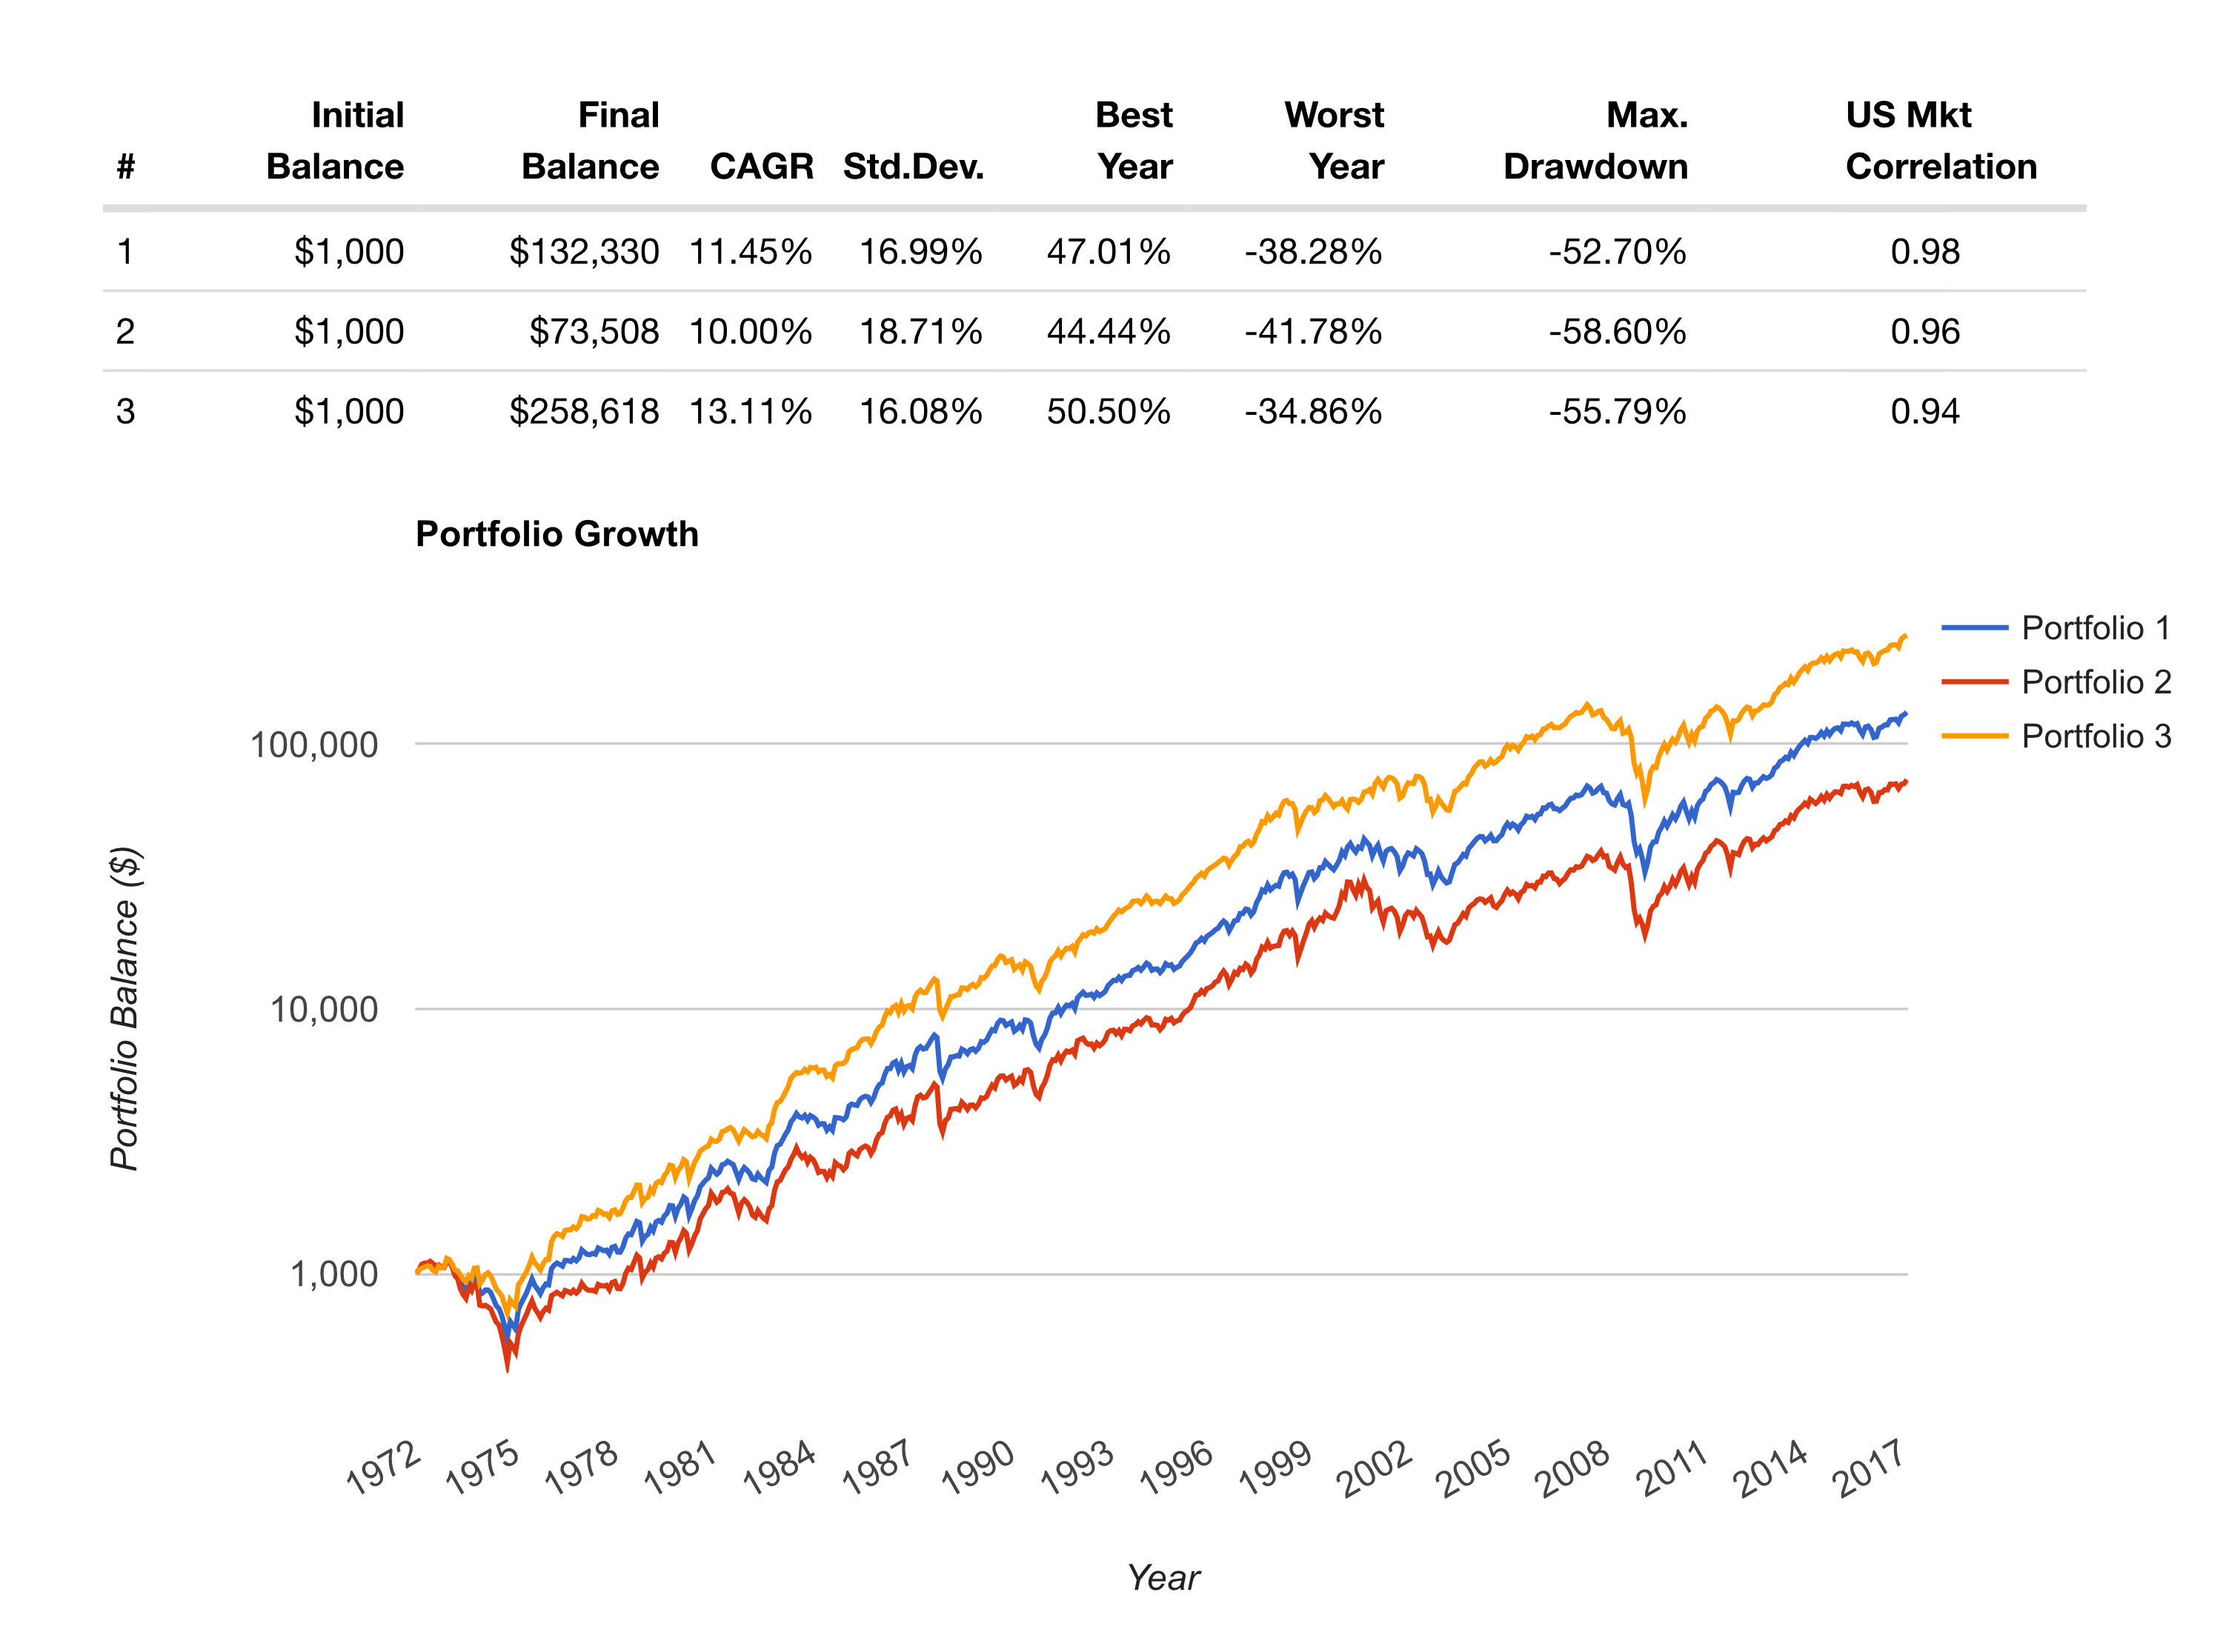
Equally Weighted Large, Mid, and Small Cap Portfolio Performance Since 1972
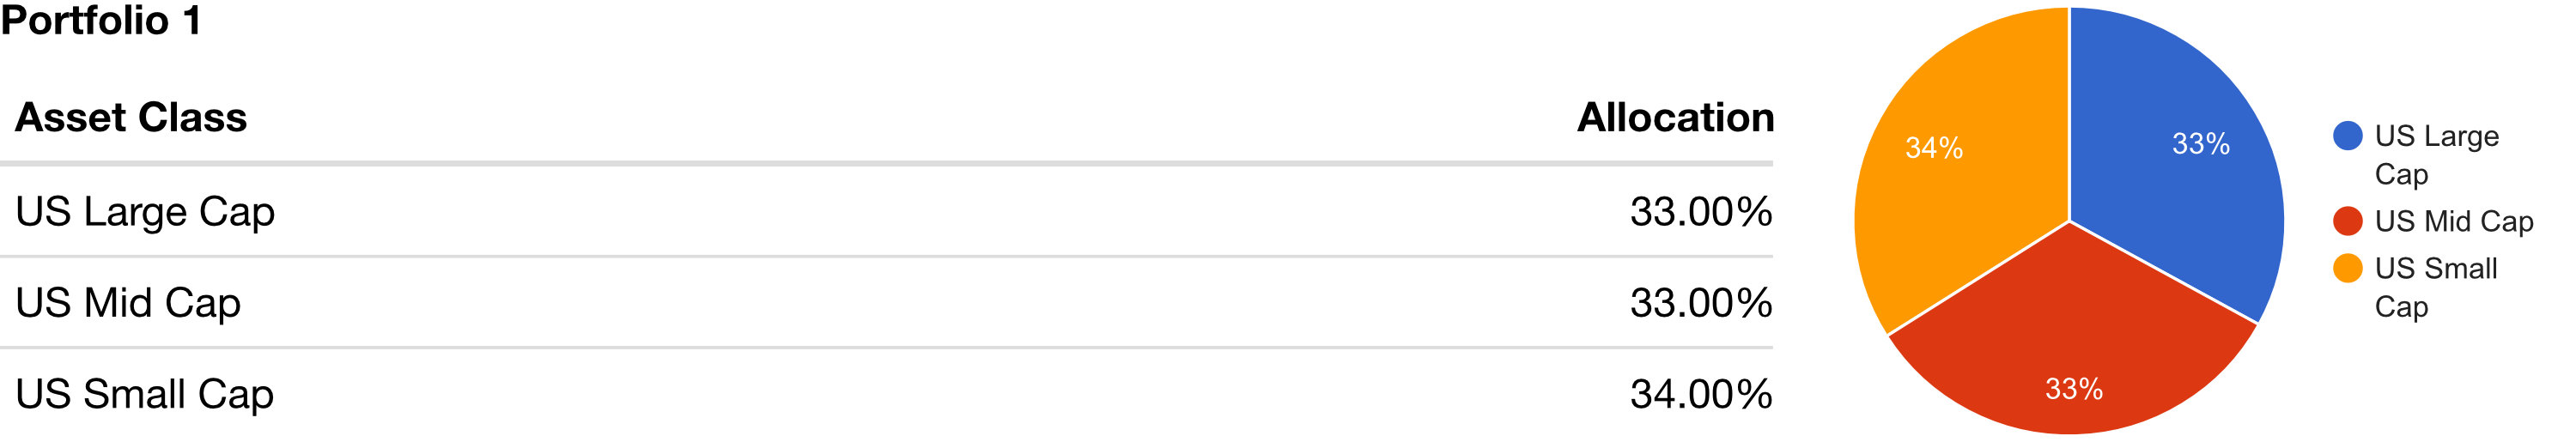
If one were to have invested $1,000 in the a portfolio consisting of roughly equal allocations of large market capitalization (“Large Cap”) stocks, mid-cap and small cap stocks in January of 1972, it would have grown to $132,330 by January of 2017. The compound annual growth rate (CAGR) of this portfolio was 11.45%. The maximum drawdown around the 2008 financial crisis was 52.70% (stressful).
During this same time, if one were to invest $1,000 in “US Stocks” the CAGR would have been 10.21%, balance on January 2017 would have been $80,008, and the maximum drawdown would have been 50.89%.
Source: portfoliovisualizer.com
What about Growth Stocks?
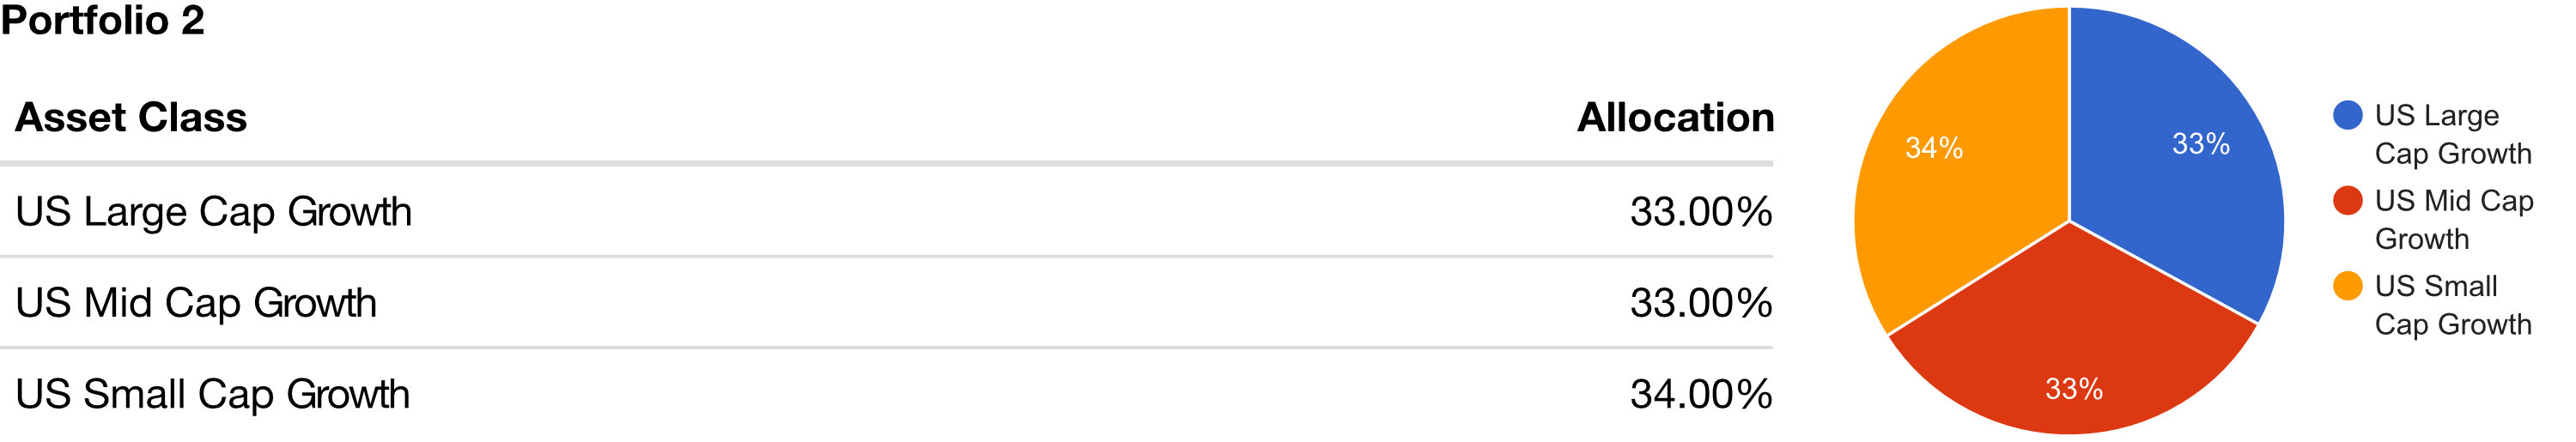
A portfolio with 1/3 large, 1/3 mid and 1/3 small cap growth stocks would have done even worse than the allocation above. The CAGR since 1972 has been 10%, the maximum drawdown was 58.6% (wow!), and $1,000 would have grown to $73,508.
So growth stocks performed worse.
Source: portfoliovisualizer.com
US Value Stocks have Outperformed

US value stocks have outperformed growth stocks. A portfolio mixed with 1/3 large cap value, 1/3 mid cap value and 1/3 small cap value would have a CAGR of 13.11%.
A $1,000 investment in 1972 would have grown to $258,618. The maximum drawdown would have been slightly higher than straight market cap stocks, at 55.79% (still stressful) but less than the growth stock portfolio.
Source: portfoliovisualizer.com
What it All Means
There are two main takeaways.
- Value stocks outperform other stocks classes
- A small increase in the CAGR has a large impact if the time horizon is long enough
- US value stocks had a lower maximum drawdown than growth stocks
- US value stocks have higher maximum drawdown than stocks in general
Source: portfoliovisualizer.com
For more details on this data see the portfoliovisualizer.com FAQ.
by John | Feb 5, 2017 | Passive Income, Value Investing
My desire for improvement has lead me to search for better metrics for value investing.
My belief in the power of value investing is unchanged but the metrics I look at have evolved.
Most people instinctively want to buy things on sale to get a great deal. But for some reason there is an exception when it comes to investing–people tend to buy stocks that are expensive.
Value investing takes the principle of finding a great deal and applies it to the stock market.
The the goal of value investing is to find profitable companies trading at a discount.
I’ve written in the past about value investing metrics and how it is one of the ways I grow and protect my wealth.
But if I can find a better and more reliable way to find a great deal I’m going to use that method.
The first reason I questioned the metrics I had been using was an article by Jason Rivera: “Why The P/E Ratio Is Useless – And How To Calculate EV” which is an excellent read.
The second was a video by Simon Black of SovereignMan.com: “How to identify the most compelling investments on the planet“.
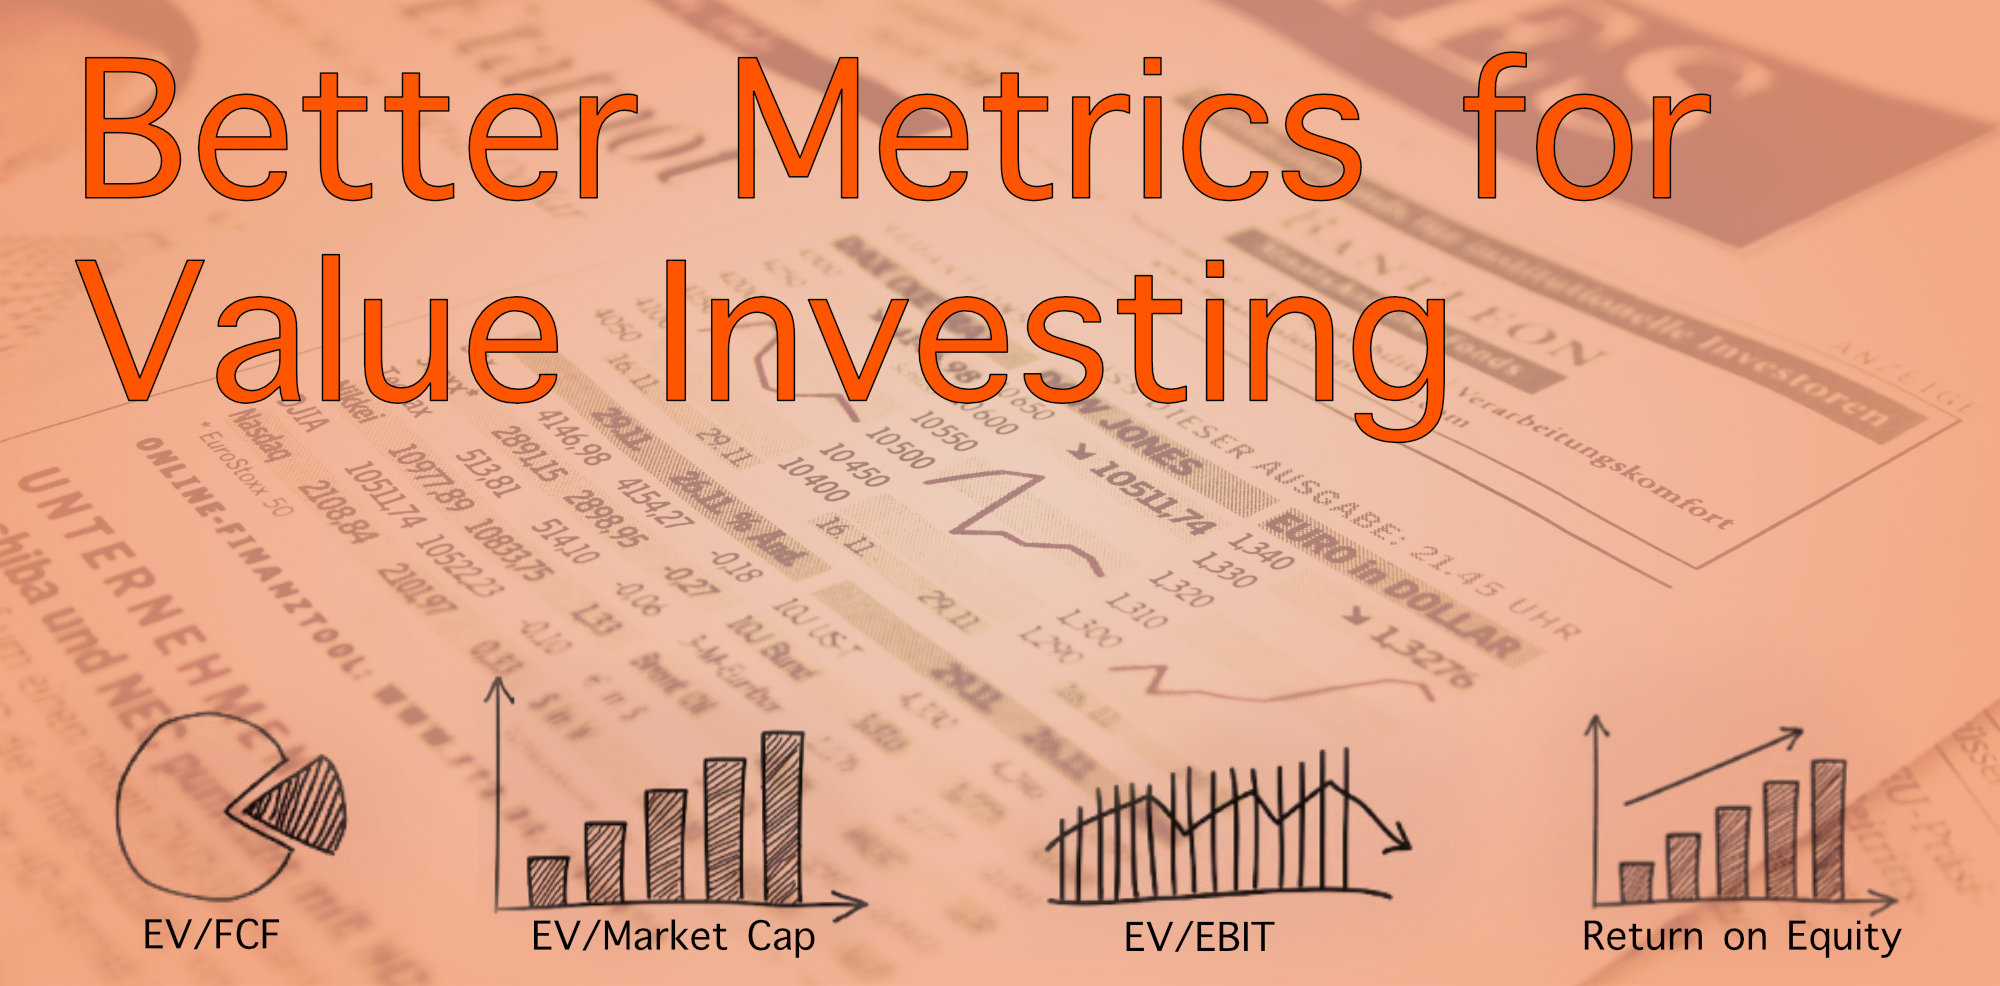
Better Value Investing Metrics
So what metrics am I using to find great deals on stocks?
1) Enterprise Value to Market Capitalization (EV/Market Cap)
2) Enterprise Value to Free Cash Flow (EV/FCF)
3) Enterprise Value to Earnings Before Interest and Tax (EV/EBIT)
4) Enterprise Value to Owners’ Cash Profits (EV/OCP)
5) Operating Margin
6) Dividend Yield
7) Return on Equity (ROE)
If you aren’t familiar with some of these terms, no worries, just click on the word to view the definition in the glossary.
The Metrics
Enterprise Value to Market Capitalization (EV/Market Cap)
This ratio indicates if a company has more cash than debt. I look for a value of less than 1, the lower the better.
If a companies EV or TEV is less than its market cap its means that the company has more cash than debt. And may be undervalued. Inverse is true as well.
Source: https://www.quora.com/What-does-it-mean-when-enterprise-value-is-more-than-market-cap
Enterprise Value to Free Cash Flow (EV/FCF)
This is a more reliable metric than price to earnings (PE) (more on that in a subsequent article). It takes the enterprise value and divides it by free cashflow. I want this to be as low as possible.
A lower number indicates one is paying less for a stream of cash flowing into a company than compared to a higher number.
Enterprise Value to Earnings Before Interest and Tax (EV/EBIT)
Another metric that is more reliable than PE. It’s a way to double check the cost of a cashflow stream. The lower the better.
Enterprise Value to Owners’ Cash Profits
A third replacement for PE.
If EV/FCF, EV/EBIT, and EV/OCP are all low, that is several metrics that indicate the stock is trading at a discount relative to peers with a higher ratio.
Operating Margin
This is a measure of efficiently. A higher operating margin is better than a lower one.
Dividend Yield
A company can’t fake dividends. The dividend is money that goes directly to a shareholder and the yield is how much the dividend costs as a function of the share price. Investing in a stock with a dividend yield is also a way to collect income while waiting for the company’s share price to rise in value to reflect the fundamental indicators.
The higher the dividend yield the better–all else equal.
Return on Equity over 8%
This is another metric that indicates if a company is profitable. Relying on multiple metrics versus one or two provides multiple failsafes to increase the likelihood one is purchasing a valuable company at a discount.
The Stocks I Like Based on These Metrics
I list my Value Stock Picks, which are based on the value investing metrics I use.
Subscribers to the HowIGrowMyWealth Email Newsletter know that I’ve been selling a fair amount of stock as a result of these refined metrics.
Some of that is profit taking, but these metrics have also enabled me to see problems with certain stocks that I otherwise thought were a great value.
HIGMW Email Subscribers also learned of my latest value stock picks back on the 2nd of February.
by John | Jan 9, 2017 | Options, Stocks I Like, Value Investing
Value Stock Picks – January 2017
I’m a value investor which means I buy stock in profitable companies trading at a discount.
I’ll be tracking the stocks I like over at my Value Stock Picks page.
The information presented here, like all the content on this website, is not investment advice. These are stocks I own (or intend to own) but they might not be suitable for you. The information presented is accurate to the best of my knowledge, but no guarantee of accuracy is made.
Prices are as of 11 January 2017 on market close, unless otherwise noted. Market data is from morningstar.com.
Korea Electric Power Corp (KEP on NYSE)
| Price |
Market Cap |
Shareholder’s Equity |
Price to Book |
Earnings per Share |
Yield |
Return on Equity (TTM) |
Price to Earnings (TTM) |
| $18.27 |
$23.5 bil |
$56.3 bil (converted from KRW) |
0.4 |
$8.74 (converted from KRW) |
7.63% |
12.2% |
3.3 |
 Korea Electric Power Corp “KEPCO” is a large cap electric company that transmits and distributes nearly all the electricity in South Korea.
I like this stock because the company pays a very nice yield. They have net income growth the past three years. I also think that people aren’t going to stop using electricity anytime soon, so it is in a good industry. With a price to book of just 0.4 it’s a steal.
It is an ADR, which isn’t my preference. But is is optionable.
I own 100 shares of KEP and have sold a covered call.
Brookfield Property Partners (BPY on NYSE)
| Price |
Market Cap |
Shareholder’s Equity |
Price to Book |
Earnings per Share |
Yield |
Return on Equity (TTM) |
Price to Earnings (TTM) |
| $22.17 |
$5.8 bil |
$7.4 bil |
0.8 |
$3.6 |
5.05% |
6.9% |
6.6 |
I would rather own real-estate directly because doing so provides crazy tax benefits. Despite looking into real estate previously I’m not in a position to join the class of landed gentry.
An alternative way to be a part of the real estate market is through a real-state investment trust (REIT).
A REIT is a company that owns, and often operates, income-producing real estate.
Like many other companies Brookfield Property (BPY) has issued stock that can be purchased.
BPY is a REIT that pays a nice 5% dividend and is currently trading at a 20% discount to it’s book value. It’s had modest revenue growth over the past three years and is profitable.
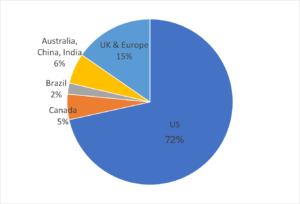
The properties BPY owns operates and invests in are located in North America, Europe, Australia and Brazil.
Unfortunately most of the assets under management are in the US (72%). I would prefer seeing more exposure in Brazil, Australia, and Asia.
Source: http://bpy.brookfield.com/~/media/Files/B/Brookfield-BPY-IR/events/BPY%20Corporate%20Profile%20November%202016%20FINAL.pdf
BPY is optionable. I currently have an option position on this stock and intend to acquire shares of this stock directly in the near future.
by John | Dec 11, 2016 | Stocks I Like, Value Investing
Value Stock Picks – December 2016
I’m a value investor which means I buy stock in profitable companies trading at a discount.
I have hopes for a paid stock newsletter (Global Value Intelligence). But I’ve decided to put GVI on hold and share what I’ve written in past GVI issues, as well as provide new stock information. I intend for this information to remain free for some time.
I’ll be tracking the stocks I like over at my Value Stock Picks page.
The information presented here, like all the content on this website, is not investment advice. These are stocks I own (or intend to own) but they might not be suitable for you. The information presented is accurate to the best of my knowledge, but no guarantee of accuracy is made.
Prices are as of 9 December 2016 on market close, unless otherwise noted. Market data is from morningstar.com.
Below are some of the stocks I like:
Nissan (NSANY on NYSE)
| Price |
Market Cap |
Shareholder’s Equity |
Price to Book |
Earnings per Share |
Yield |
Return on Equity (TTM) |
Price to Earnings (TTM) |
| $19.58 |
$38.7 bil |
$40.9 bil (converted from JPY) |
1.0 |
$2.16 (converted from JPY) |
4.20% |
10.5% |
9.5 |
Nissan has a price to book of 1.0 and an attractive 4.20% yield. It is an ADR and has no options. I generally prefer to own a stock on it’s native exchange, with the ability to sell covered calls, but I still like this stock for it’s attractive metrics, brand and yield.
Transocean (RIG on NYSE)
| Price |
Market Cap |
Shareholder’s Equity |
Price to Book |
Earnings per Share |
Yield |
Return on Equity (TTM) |
Price to Earnings (TTM) |
| $15.42 |
$5.6 bil |
$14.5 bil |
0.4 |
$2.16 |
– |
8.1% |
4.7 |
The oil market in general has been pretty beaten down of late. The price to book is 0.4 which amounts to a 60% off sale. Despite the low price, Transocean is profitable, boasting $791 million in net income in 2015.
Mount Gibson Iron (MGX on ASX)
| Price |
Market Cap |
Shareholder’s Equity |
Price to Book |
Earnings per Share |
Yield |
Return on Equity (TTM) |
Price to Earnings (TTM) |
| A$0.34 |
A$372.8 mil |
A$392 mil |
0.9 |
A$0.08 |
– |
24.7% |
4.4 |
I first discussed MGX in the October 2016 Global Value Intelligence Dispatch (GVI has since been put on hold). At that time it was trading at A$0.29.
Writeup as of October 2016
MGX is an iron ore mining company in Western Australia. It can boast A$392 million in shareholder’s equity but is trading at a market capitalization of just A$318 million. This means the company’s stock could rise by over 23% before its market value would even be equal to its equity.
Mount Gibson Iron recently received a A$86 million insurance settlement and is set to receive an additional payout in the future. Not only is this company undervalued but it brought in A$6 million in the three month quarter ending in June.
PanTerra Gold (PGI on ASX)
| Price |
Market Cap |
Shareholder’s Equity |
Price to Book |
Earnings per Share |
Yield |
Return on Equity (TTM) |
Price to Earnings (TTM) |
| A$0.08 |
A$9.6 mil |
A$39 mil |
0.2 |
A$0.41 |
– |
138.9% |
0.4 |
I first discussed PGI in the October 2016 Global Value Intelligence Dispatch (GVI has since been put on hold). At that time it was trading at A$0.08.
Writeup as of October 2016
This stock is currently trading for 1/3 the book value and presents an exceptional value.
Despite the low Price to Book ratio PGI is still profitable. PGI brought in A$8 million in cash in 2015. In the most recent quarter PGI reported a 4% increase in gold production over the prior quarter and operating costs
3.7% lower.
Gold and gold miners have been beaten down over the past few years. By purchasing a stock in a depressed sector below book value there is a great deal of downside protection.
Triton International (TRTN on NYSE)
| Price |
Market Cap |
Shareholder’s Equity |
Price to Book |
Earnings per Share |
Yield |
Return on Equity (TTM) |
Price to Earnings (TTM) |
| $19.23 |
$674.3 mil |
$665 mil |
1.0 |
$2.67 |
9.16% |
10.7% |
9.4 |
I first discussed TRTN in the October 2016 Global Value Intelligence Dispatch (GVI has since been put on hold). At that time it was trading at $13.19.
Writeup as of October 2016
Triton International trades and leases intermodal containers and chassis. It features an attractive price to book ratio combined with a high dividend yield.
Triton recently merged with TAL and paid out a $.45 dividend on 22 September. This high dividend is most likely not sustainable. Shipping has been declining of late, but TRTN still managed to bring in $18.2 million in pre-tax income in Q2 2016.
Noble Energy (NE on NYSE)
| Price |
Market Cap |
Shareholder’s Equity |
Price to Book |
Earnings per Share |
Yield |
Return on Equity (TTM) |
Price to Earnings (TTM) |
| $7.64 |
$1.9 bil |
$6.69 bil |
0.2 |
$2.06 |
5.07% |
3% |
7.8 |
I first discussed NE in the October 2016 Global Value Intelligence Dispatch (GVI has since been put on hold). At that time it was trading at $6.34.
Writeup as of October 2016
Oil has been falling and with it the value of energy producers. Despite falling oil prices, NE is a fantastic value. The company has $6.7 billion in shareholder’s equity, but is trading with a Market Capitalization of $1.5 billion.
The 5.36% yield is attractive but not sustainable. Despite low oil prices Noble Corp is profitable. The most recent quarter that ended in June resulted in $687 million in cash from operations.
Anthem (ANTX on NYSE)
| Price |
Market Cap |
Shareholder’s Equity |
Price to Book |
Earnings per Share |
Yield |
Return on Equity (TTM) |
Price to Earnings (TTM) |
| $47.07 |
$12.4 bil |
$23 bil |
0.5 |
$9.38 |
2.77% |
9.5% |
5.5 |
I first discussed ANTX in the November 2016 Global Value Intelligence Dispatch (GVI has since been put on hold). At that time it was trading at $46.83.
Writeup as of November 2016
Anthem is a mid-sized health benefits company that works with employers and individuals to offer network based healthcare plans. While recent government incursions into the healthcare industry make me leery to invest in this sector I find the metrics to be quite favorable.
The Price to Book ratio is excellent, the yield is attractive and the company is profitable. I also think Anthem is well positioned to benefit from the “baby-boomer” generation (those age 50-85) as more of them retire each year.
Disclaimer:
As of 11 December 2016 John owns shares of NSANY, RIG, MGX, PGI, TRTN, NE, and ANTX. When possible he has also sold covered calls on these same securities.
Data is from morningstar.com.