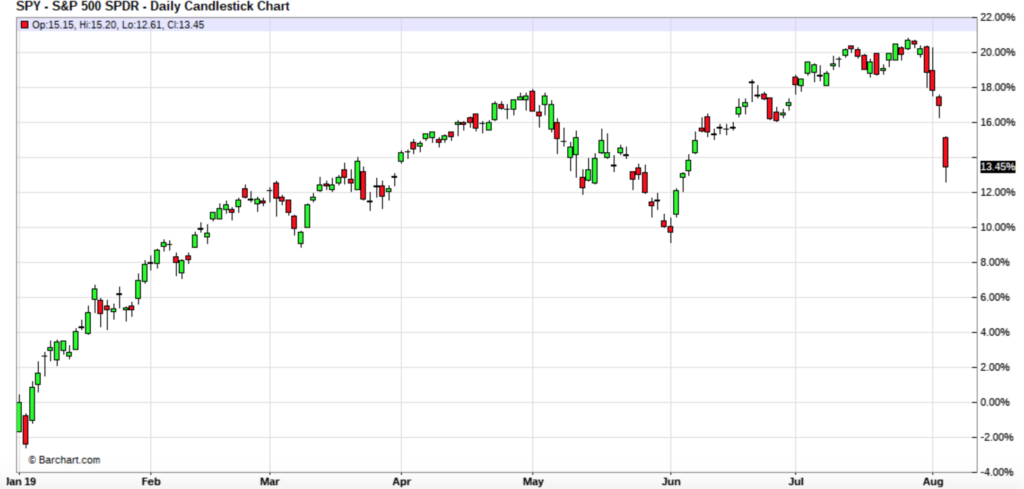
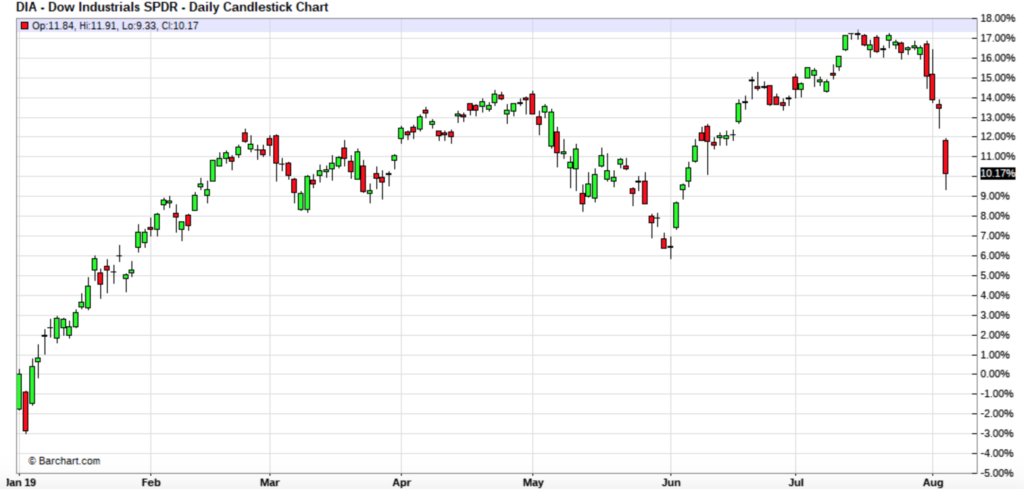
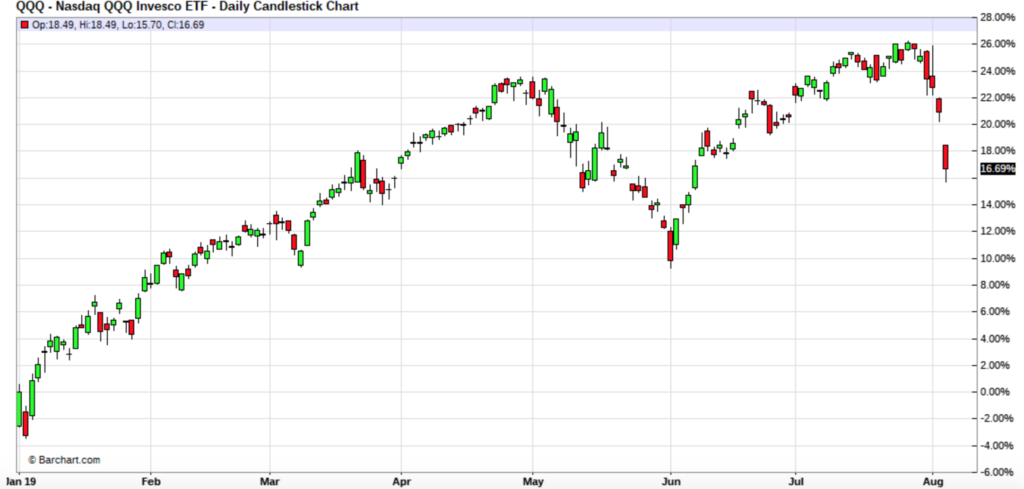
The major US indices were down today, each about 3%, likely triggered by the inversion of treasury yields as well as cynicism regarding a US-China trade deal.
The yield on the 10-year treasury note fell below the yield of the 2 year treasury note for the first time since May 2007.
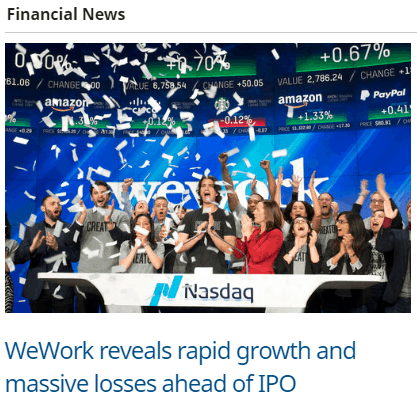
Does this one article title sum up the US stock market? Source: barchart.com
Normally if you are loaning money for 10 years, you demand a rate of return greater than if you’re loaning money for 2 years. In other words, longer term debt should pay more interest than shorter term debt. When this isn’t true, it’s called inversion.
The fact that the yield on the 10-year was less than the 2 year (ie inverted) is a bad sign that historically indicates an incoming recession.
What do negative yields mean?
The way the government responds during a recession is to lower interest rates and spend money. This is the conventional, Keynesian approach, often referred to as monetary stimulus.
Unfortunately, this only makes the problem worse, but the government doesn’t realize that and it will be what they do in the next downturn.
Interest rates are already low, and so there isn’t a lot of room to cut before hitting 0%.
Rational people have positive time preference, meaning that they would rather have $1 now than $1 ten years from now. If you’re going to loan a stranger $1, you’re going to want interest, partly because there is a risk they won’t pay you back and partly because rational, normal people have a positive time preference.
What would negative time preference look like? A person with a negative time preference would rather have $.90 ten years from now rather than $1 now.
You can’t find real people who have negative time preference.
However, former Fed Chair Alan Greenspan, famous for inflating the 2000 stock market bubble and thus causing the subsequent crash doesn’t think negative yields are a problem.
“There is no barrier for U.S. Treasury yields going below zero. Zero has no meaning, beside being a certain level.”
He and many other supposed technocrats don’t have a problem with negative yields on debt. That combined with the lack of room to maneuver means that if there is a stock market correction or crash, once the Fed cuts rates to zero and restarting quantitative easing and asset purchases, negative rates are not far behind.
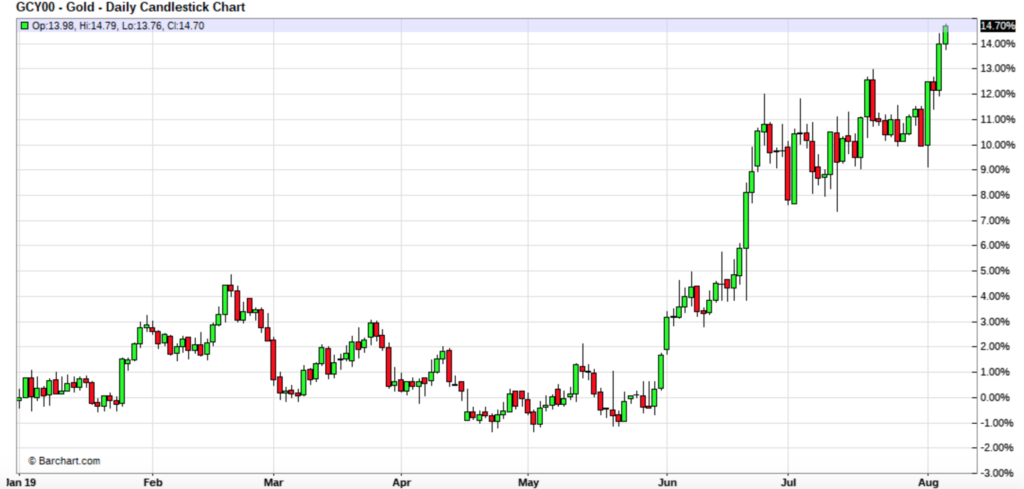
Gold should do well in this environment.
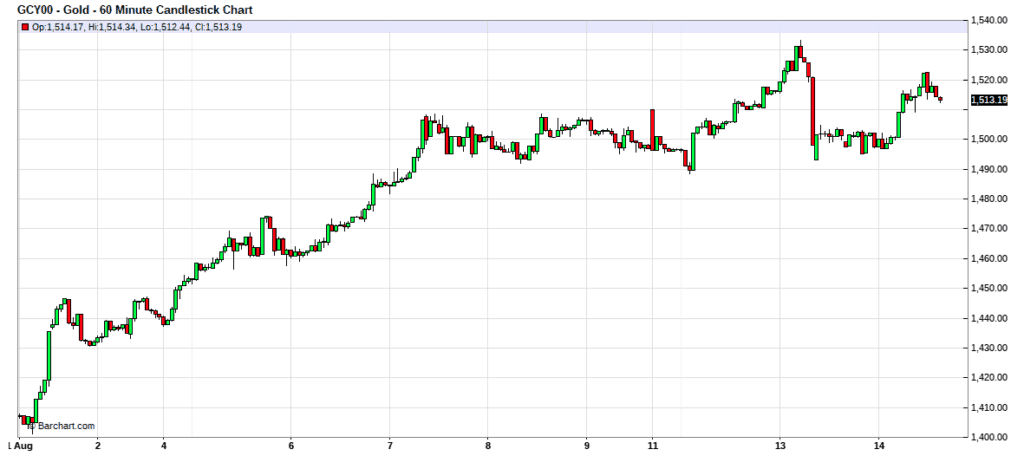
Gold has been bouncing around between $1,490s and $1,510, with a brief breakout attempt on the 13th in which the spot price of gold went as high as $1,530 before retesting supporting at the $1,490s. The yellow metal is up over 17% on the year.
I think we’ll see $1,600 per ounce gold this year, and it could go even higher before 2020 arrives.
There is more bad news coming out for Tesla (NASDAQ: TSLA). First, there is a lawsuit pending against CEO Elon Musk and former Tesla CFO that alleges they mislead investors about Model 3 production.
One claim of the lawsuit is as follows:
“As early as mid-2016, Tesla executives responsible for planning and building the Model 3 production line plainly told Defendant Musk and the other Defendants in person, providing specific support for their statements that the Company could never mass produce the Model 3 by the end of 2017. These Tesla executives told Musk and the other Defendants that it was an impossible goal.”
Tesla has a strong history of not meeting their production goals. I’m not saying they always fail to meet their admittedly ambitious goals and below I chronicle a few examples where they did not
Let start with their most recently reported numbers and compare them to past guidance.
According to the Tesla, in a 3 April 2018 release, their Q1 2018 production totaled 34,494 vehicles. Of those 24,728 were Model S and Model X, and 9,766 were Model 3.
“Our Model 3 program is on track to start limited vehicle production in July and to steadily ramp production to exceed 5,000 vehicles per week at some point in the fourth quarter [2017] and 10,000 vehicles per week at some point in 2018.”
Unfortunately Tesla would only produce 2,425 Model 3s in Q4 of 2017. This means that instead of making 5,000 Model 3s in 1 week they made less than half of that in a span of 13 weeks.
In Q1 2018 so far Tesla has produced, on average, 2,653 total vehicles per week and only 752 Model 3s per week.
So to get to 10,000 Model 3s “sometime” in 2018 weekly Model 3 production would have to go up over 1,229% in the next 9 months.
How was Tesla’s Q4 2017 Guidance?
Model S burning in 2013. Photo from autoblog.com
The Q4 2017 Update Letter stated:
“We continue to target weekly Model 3 production rates of 2,500 by the end of Q1 and 5,000 by the end of Q2. It is important to note that while these are the levels we are focused on hitting and we have plans in place to achieve them, our prior experience on the Model 3 ramp has demonstrated the difficulty of accurately forecasting specific production rates at specific points in time.”
Well at least they are admitting predictions are difficult! We know from the 3 April 2018 release that in the last week of Q1 Tesla only produced 2,000 model 3s and on average in Q1 2018 Tesla only produced 752 Model 3s. In total they produced just 9,766 Model 3s.
But that didn’t stop them from bragging, “The Model 3 output increased exponentially, representing a fourfold increase over last quarter.” Well Q4 2017 Model 3 production was just 2,425 so going up to 9,766 isn’t that great especially when you said you’d be producing that many a week 3 months ago.
“In the past seven days, Tesla produced 2,020 Model 3 vehicles. In the next seven days, we expect to produce 2,000 Model S and X vehicles and 2,000 Model 3 vehicles. It is a testament to the ability of the Tesla production team that Model 3 volume now exceeds Model S and Model X combined. What took our team five years for S/X, took only nine months for Model 3.
Given the progress made thus far and upcoming actions for further capacity improvement, we expect that the Model 3 production rate will climb rapidly through Q2. Tesla continues to target a production rate of approximately 5,000 units per week in about three months, laying the groundwork for Q3 to have the long-sought ideal combination of high volume, good gross margin and strong positive operating cash flow. As a result, Tesla does not require an equity or debt raise this year, apart from standard credit lines.”
I read that as a total of 4,000 vehicles per week, at least in “the next seven days”. Then they go on to say that they will produce 5,000 units (which I read as Model 3s) by June.
They would need to more than double their Model 3 production in the next 3 months to hit their targeted production rate of 5,000 units per week by June.
How likely is Tesla’s Q1 2016 Guidance?
In 2016 Tesla said they were planning to build half a million vehicles in 2018. This got a lot of press at the time and people were all excited.
The Q1 2016 Update Letter stated:
“Additionally, given the demand for Model 3, we have decided to advance our 500,000 total unit build plan (combined for Model S, Model X, and Model 3) to 2018, two years earlier than previously planned. Increasing production five fold over the next two years will be challenging and will likely require some additional capital, but this is our goal and we will be working hard to achieve it.”
How likely is Musk and Company to produce this many vehicles?
Well let’s assume for a minute that Tesla, starting in Q2 is able to produce on average 4,000 (Model X, S, 3) vehicles per week in Q2 for a total of 52,000.
Then they are able to produce 7,000 vehicles (Model X, S, 3) for the remainder of the year without disruption for a second half total of 182,000.
Those three quarters combined would be 234,00 vehicles and added to the 34,494 produced in Q1 and you get to 268,494, so its a little over half of the stated goal they listed in the Q1 2016 Update Letter.
Remember Tesla did not produce 4,000 vehicles in a week in Q1. They said “In the next seven days, we expect to produce 2,000 Model S and X vehicles and 2,000 Model 3 vehicles.” Bold added.
On average in Q1 the total combined production was just 2,688. So thinking they could produce 4,000 vehicles a week consistently, in Q2 and 7,000 in the second half of 2018 is giving Tesla a big benefit of the doubt.
Another way to look at it is even if they can double production starting in Q2, up to 5,376 total vehicles per week they would only get to 209,664 by the end of the year. So it seems highly unlikely Tesla will reach 500,000 vehicles produced by the end of 2018.
A picture of the 25 March 2018 Tesla crash which resulted in a fatality. Photo From Business Insider
In addition to the lawsuit the other recent bad news for Tesla is in regard to Model 3 production. Production of the Model 3 has halted at least twice already in 2018, first in February from the 20th-24th. Another halt started today and is estimated to last 4-5 days.
To paraphrase Yogi Berra, forecasting is hard, especially about the future. However, providing the best possible “forward guidance” is what publicly traded companies are expected to do. At best Tesla is not very good at predicting what they will be able to do and at worse they are being deceptive. To be clear I am not saying Tesla intentionally attempting to deceive investors.
I do think that Elon Musk, at times, has demonstrated a rather fluid relationship with reality.
On the one hand I admire his vision, I remember doing some research into Mars exploration and terraforming when I was in college so it is exciting that Musk is interested in colonizing the red planet as well. Flamethrowers are also awesome. The idea of the hyperloop is a fascinating concept.
The guy is not afraid to dream big and I admire him for that. But on the other hand I think it is possible that he misleads investors and with billions on the line I have a problem with that.
People are taking notice. A recent tweet by the Economist prompted an almost Trumpian response (and forward guidance about Q3 and Q4) from Musk.
The Economist used to be boring, but smart with a wicked dry wit. Now it’s just boring (sigh). Tesla will be profitable & cash flow+ in Q3 & Q4, so obv no need to raise money.
I predict that Tesla will not be cashflow positive in Q3 2018. I further predict Tesla will not be cashflow positive in Q4 2018.
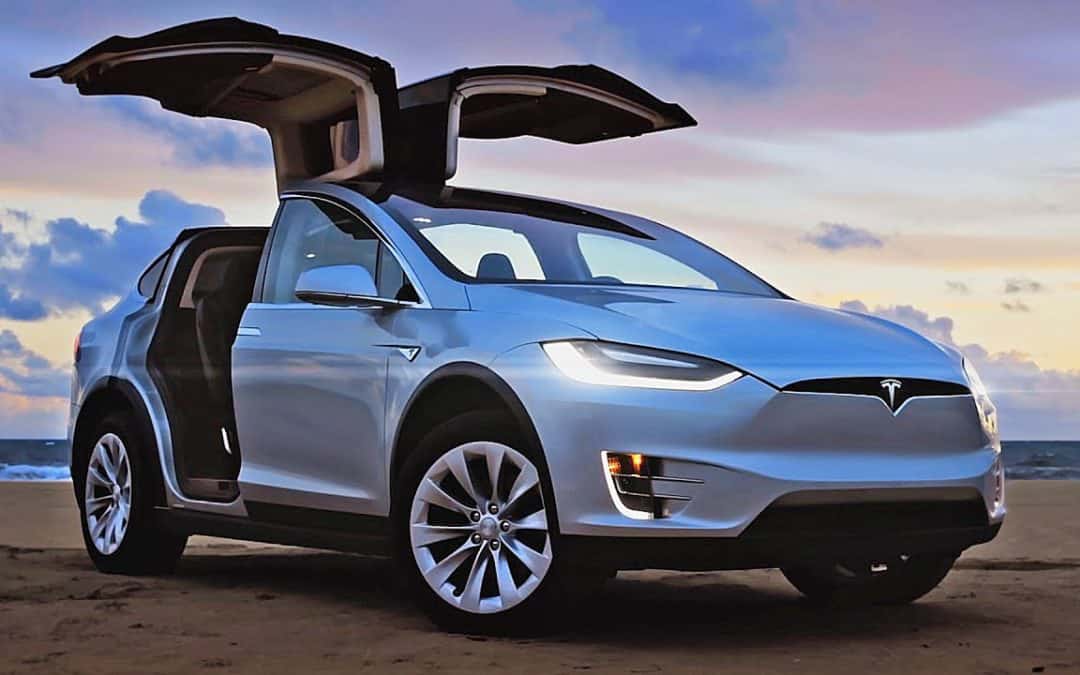
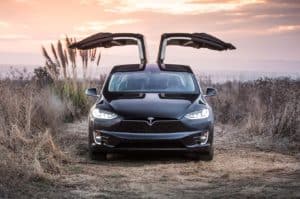
Good Marketing and Design Don’t Mean a Good Manufacturer
I’ve wanted a car with “gull-wing” doors ever since watching Back to the Future as a kid. Photo from Motor Trend
A recent article by Jim Collins points out that Tesla is a horrible automobile manufacturer.
“Tesla is the worst car manufacturer in the developed world. Bar none. Note that I didn’t write “designer” or “marketer,” but manufacturer. Musk had zero auto industry experience when founding Tesla and CTO J.T. Straubel—who according to Tesla’s 10-K filing personally holds Tesla’s important patents—developed a love for electric vehicles by rebuilding golf carts. It’s just astounding to me that the markets are affording a $50 billion valuation to a company that can’t perform the most basic task for which it was incorporated.”
Even though Tesla designs some great looking automobiles and does a heck of a job marketing them doesn’t mean Tesla is a good business or a company in which a person should invest.
And in fact quarter after quarter of negative free cashflow, missing many production targets and increasing debt would suggest that Tesla is a very bad business.
None of those facts will stop a believer from believing as summarized I think by this tweet:
A Tesla fail is now shorted by many.. They lost so much before and still haven’t learned.. Tesla is not only a business.. It’s a movement for a better future.. Shame on The Economist for not recognising
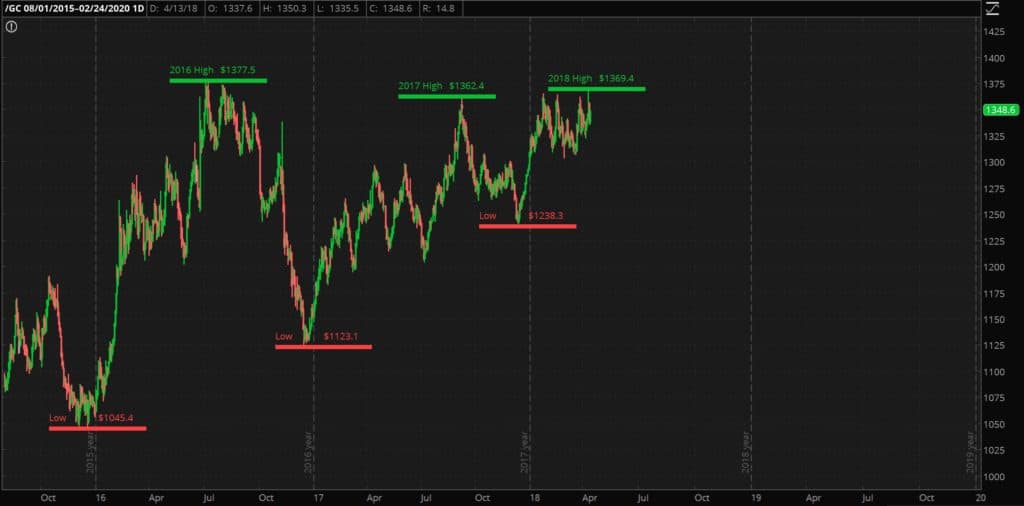
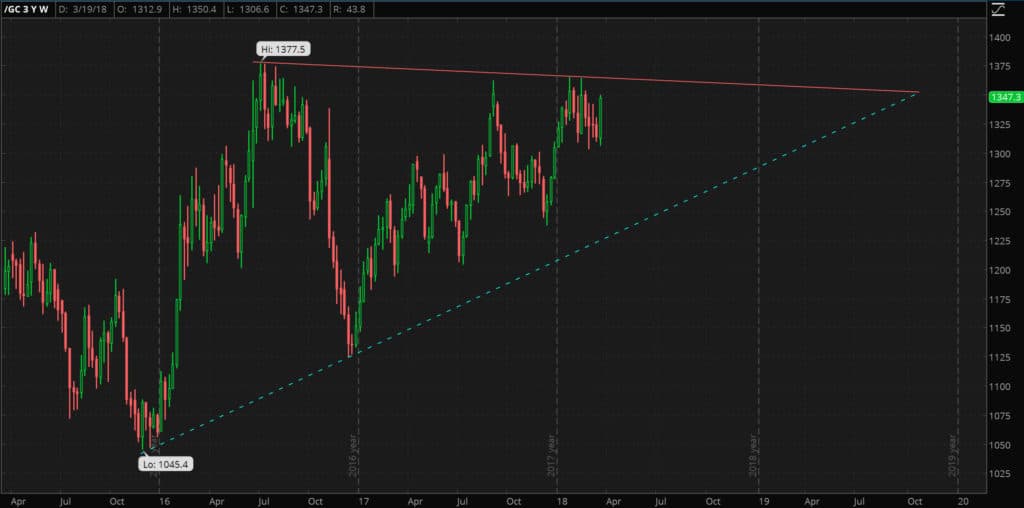
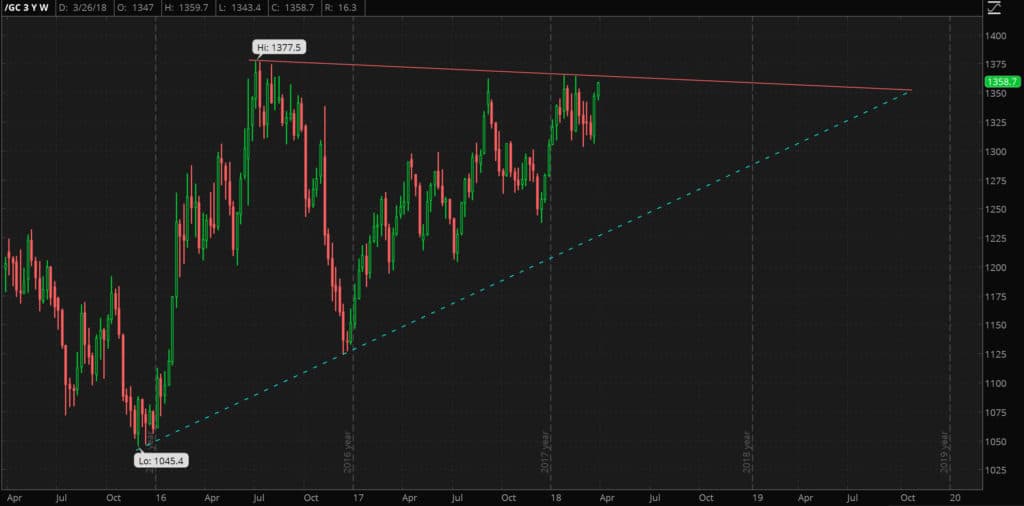
Gold has been steadily rising in an ascending triangle trading pattern since December of 2015. It’s my belief that gold bottomed in December of 2015 at $1045.4 per ounce. I don’t believe that gold will ever trade below $1045.4 again.
The highs being around the same level and then falling combined with progressively higher lows is what leads me to describe the last three years of gold price moments as an ascending triangle.
The high since gold bottomed in 2015 is $1,377.5 which occurred on 6 July of 2016. In the time between then and now gold has failed to match this high or make a new one. The price of gold has come within $20 on five separate trading days–three of which were in 2018 and one of those breakout attempts was last week.
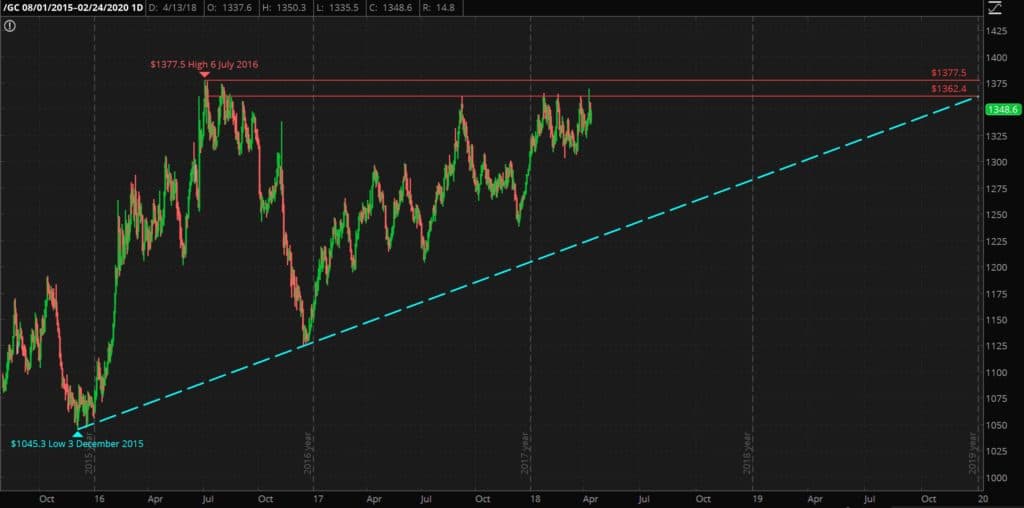
Gold has been trending upwards in an ascending triangle. The blue dashed line is what I’m calling the December 2015-December 2016 support trendline
Fundamentals for What to Buy and Charting for When
Charting is more of an art than a science and I don’t think it works well in isolation. The fundamentals of an investment need to be in place to determine what to invest in and charting may provide some insight into when an investment will move in a given direction.
Now commodities don’t have balance sheets or cashflow so the fundamentals are based on supply and demand.
The supply of gold, while growing, is fairly static, I anticipate the demand to increase substantially given my view that stocks and bonds are in a bubble and that the US Federal Reserve will step in with low interest rates and QE to reflate the bubble, as they did after both the 2000 “dot-com” crash and the 2008-2009 crisis which will eventually destroy the dollar.
It is also important to note that while the above ground supply of gold is growing, the supply of gold in the west is declining at least relative to China and India. The supply of gold might even be declining in the west on an absolute basis although I don’t know that for sure.
Even without a dollar crisis I think gold will still trend upwards over the years and it could go up several hundred dollars even without a dollar crisis simply based on technicals and trading.
Timing, however, is very challenging and it’s not a skill in which I am particularly adroit.
So I buy and hold and dollar cost average. For example if gold bounced off the lower leg of the triangle and I was under-allocated in gold I would consider buying more. At this time I already own too much gold so I haven’t been adding significantly to my holdings.
Despite gold continuing in the ascending triangle there have been some interesting price phenomena of late that merit comment.
Intraday Gold High of $1369 on 11 April
Gold hasn’t reached $1369 since August of 2016. Admittedly gold was not able hold that level last week and closed at $1356. This is still a large spike upwards. Because the fundamentals of gold are so strong I think that one of these days gold will make a new multi-year high and perhaps even hold it if it can confirm the breakout with a $50-100 move above $1377. At that point $1377 would very likely flip and represent a support level.
The $1362-$1377 has been the range of resistance for the past 2.5 years but I don’t think it will hold forever.
Lows are not reaching the Longer Term Trendline
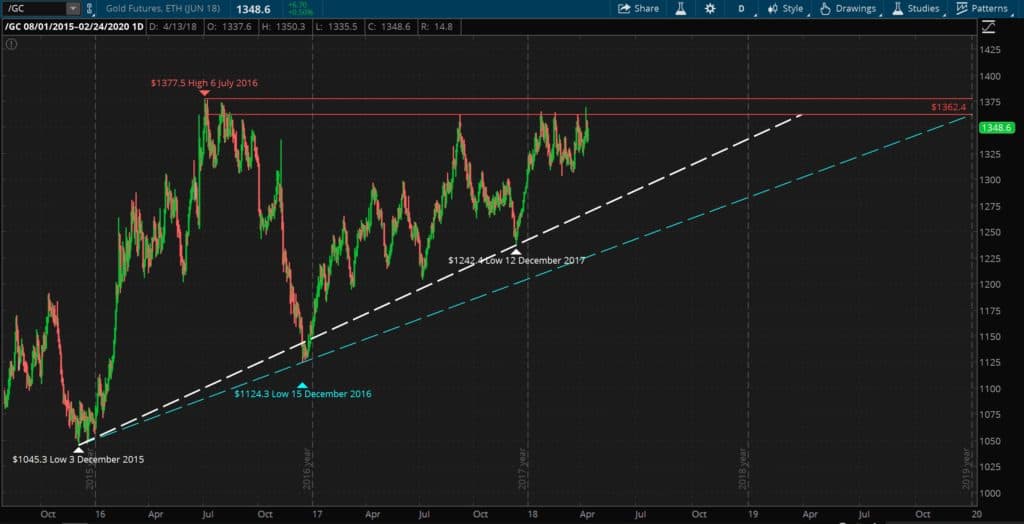
The lows have not fully dropped down to the trendline drawn from the 3 December 2015 low of $1045 to the next highest low (after a high) which was made on $1124 on 15 December 2016.
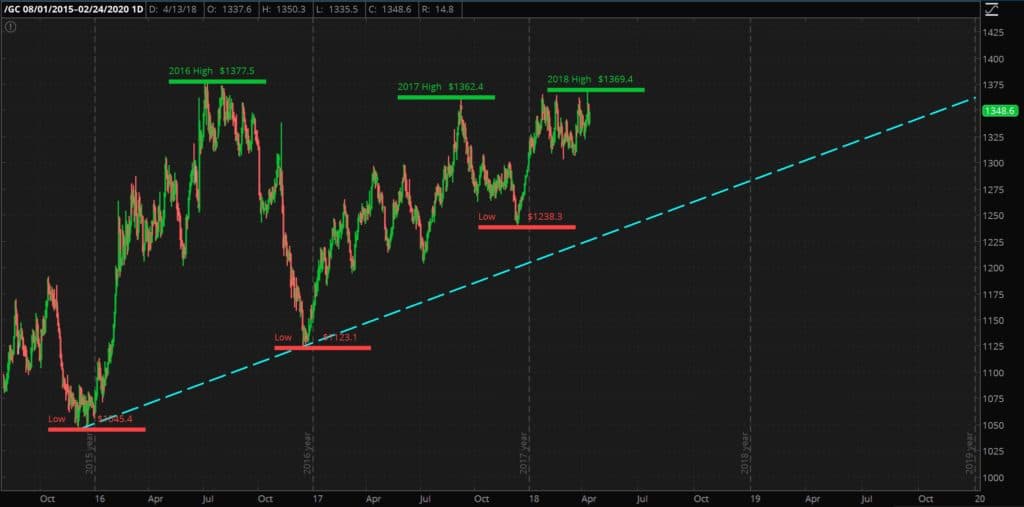
The lowest gold traded at between the 2017 and 2018 highs was $1238, and it did not reach the December 2015-December 2016 dashed blue support trendline
So while gold hasn’t been able to make it back to the 2016 muti-year high (although it has gotten within $20 five times) the lows keep getting higher.
One interpretation is that gold isn’t actually in an ascending triangle and that the December 2015-December 2016 trendline isn’t useful.
Another way to look at this price action is that gold is in an ascending triangle and the fact that the lows are getting shallower is a bullish trend.
A third is that this rally off of the 15 December 2016 low has been slower and less strong and gold will go down to hit the trendline, and may even break through, which would admittedly be bearish. It’s true that the move up nearly 32% from $1045 to $1377 only took about 6 months. It took almost 8 months to go up 21% from $1124 up to $1362.
This is where charting becomes more of an art than a science.
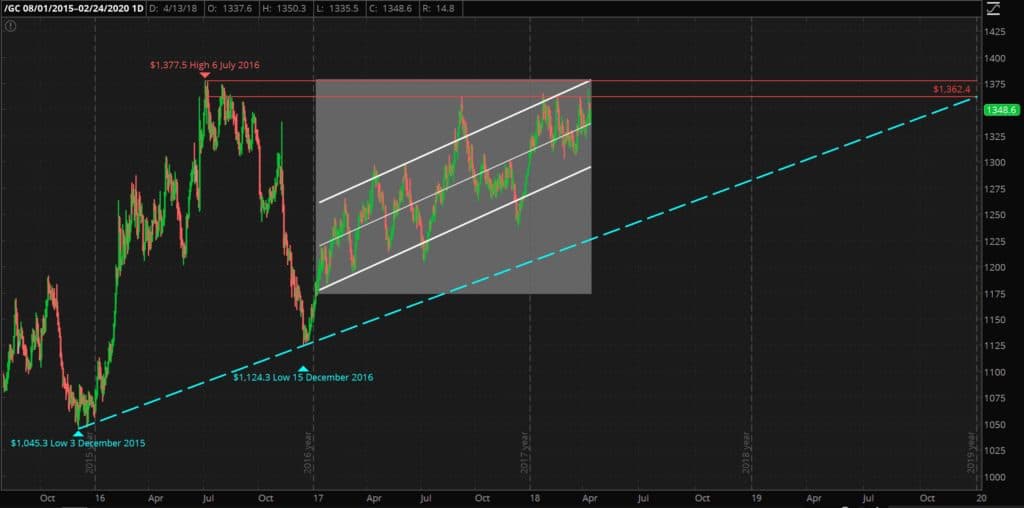
Compression of Gold’s Trading Range
The trading range of gold is compressed, even more-so than I would expect for an ascending triangle. Again, the highs haven’t been quite as high, but the lows are much higher as well. With a few outliers gold has been trading in a fairly narrow, upward range since the start of 2017.
With just a few outliers gold has traded in a fairly narrow range since the beginning of 2017
As I’ve said above the lows have not fully retraced the December 2015-December 2016 trendline. Yet another interpretation of this is that gold is in a very weak and slow rally. That the highs in 2017 and 2018 don’t count because they didn’t make it fully to $1377 and we’ll retrace the December 2015-December 2016 support trendline.
However I don’t think this is the case when you factor in market sentiment.
Gold Climbing a Wall of Worry
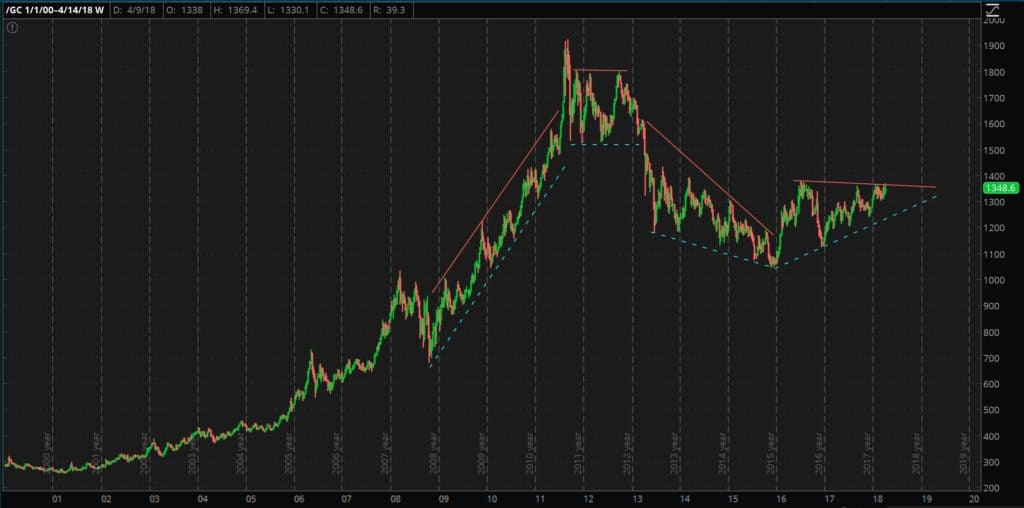
While gold has been trending up since the turn of the century, it had been a losing investment for many years in the wake of the all time highs that were made in September of 2011 in the wake of the 2008-2009 financial crisis. Gold was in a bear market for 3 years in a row from 2013 to 2015. Except for a few months, anyone who bought in 2011 or 2012 and held through to today is still underwater.
Gold has been a winner since the turn of the century
The narrative touted by Barrack Obama and now Donald Trump has been that everything is great and everything is improving. Sitting presidents always talk up the economy while they are in office because they want to get re-elected or if in their second term ensure they have a positive legacy.
Obama and Trump (at least until February 2018) have simply been after to refer to a chart of the S&P 500 as proof the economy is doing great.
So, most investors think they have no reason to own gold, since everything is great, and they don’t want to miss out on the stock market, which has been going up quite a bit until recently.
At the same time, 3 years of a gold bear market has shaken out the weak hands. There aren’t very many people who still own gold at this point who are going to sell now. If they held onto their gold as it fell from $1900 down to $1045 I don’t see why they would sell at $1150, $1250, or $1350.
So while there aren’t enough buyers stepping in to bid gold up over the 2016 high there also aren’t enough sellers for gold to drop significantly. That explains why gold can’t make new highs and why the lows continue to rise.
That is how I interpret the gold price chart.
If I’m right this also means is that when sentiment does change, when more people realize that stocks aren’t going to keep going up and that the economy isn’t great, they will move towards gold, but there won’t be many sellers, at least not at these prices. I could easily see gold going up $300 to $1600-1700 just from a technical perspective.
I do think Gold trading up to the $2000-$3000 would require a full on dollar crisis.
I don’t know when such a dollar crisis will take place. In my opinion given the debt, the lack of manufacturing, and the increase the growth the debt combined with rising interest rates that will increase the amount the US has to pay in interest on the debt are all fantastic reasons for a currency crisis to have already occurred.
Gold Market Ascending Triangle Timing
If gold is in an ascending triangle, as I believe it is, gold will break out of this pattern up or down within the next two years. Perhaps as soon as early 2019 depending on how you draw the support line. In either case I would want to see a strong move $50-100 above the $1377 resistance level to confirm trend was bullish or $50-100 below the support level as confirmation the trend was bearish.
While in the minority as gold bull I’m certainly not the only person with these views. Peter Schiff talked about the gold market trading range narrowing in a recent podcast (about 17 minutes in) and a 1 March article this year from Commodity Trading Mantra draws conclusions similar to my own.
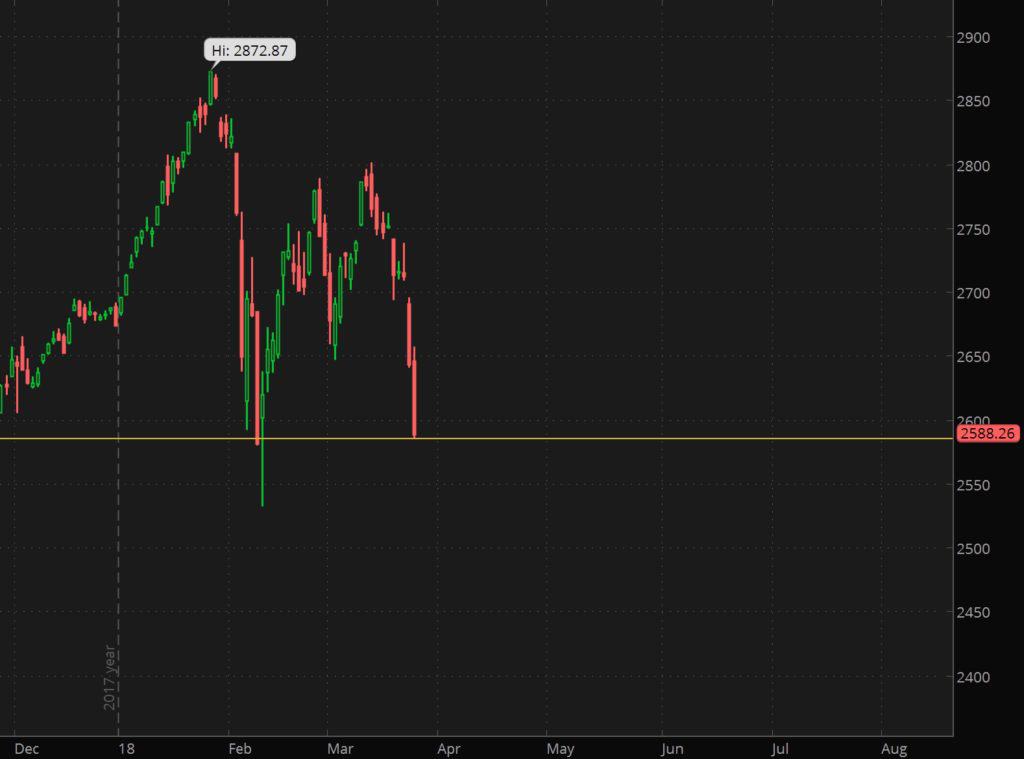
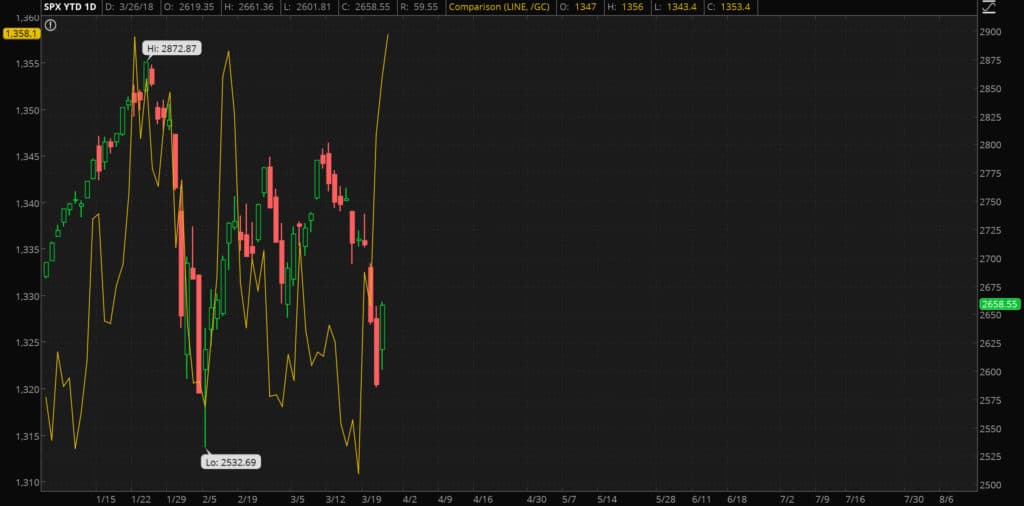
The S&P 500 was down nearly 10% from it’s January high after another significant selloff on Friday. Eight out of the last ten trading days had been negative. At Friday’s close S&P 500 was down almost 4% in 2018. The NASDAQ was flat in 2018, down 10% from the highs. The Dow Jones was down 5% on the year and 11.6% from the highs.
S&P 500 down nearly 10% from the high at the close on Friday
Gold has looked relatively stronger. The yellow metal was up a modest 2.14% on the year.
With gold holding it’s value and US equity markets in correction territory I was asking myself over the weekend, “is this the start of something bigger?”
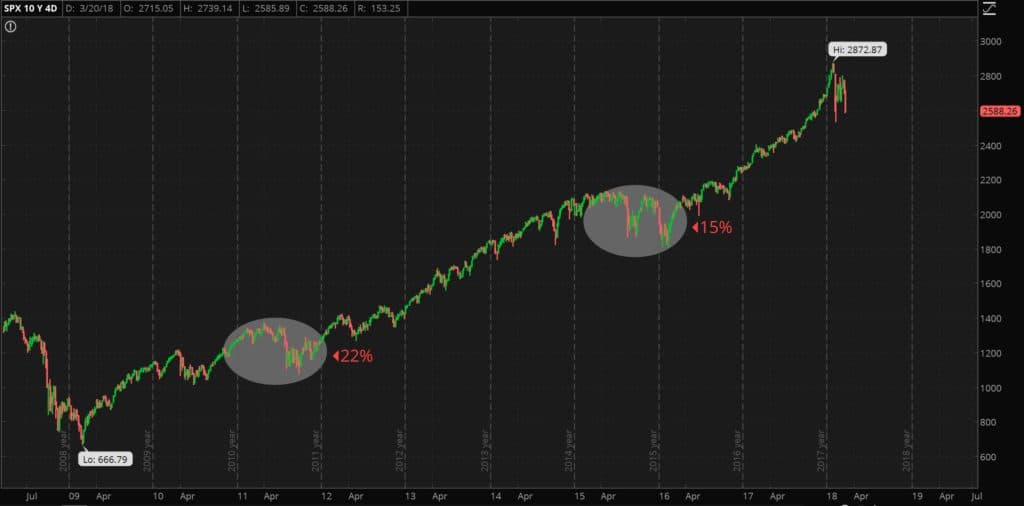
Since the lows in 2009 the S&P 500 has made some large drops. From high to low the S&P 500 dropped 17% in 2010. It went down 22% between April and September in 2011. From July of 2015 to February 2016 the S&P dropped 15%. There have also been 10% drops like in the spring of 2012 and fall of 2014.
A 10% correction in and of itself is not a big deal.
But I think when combined with trade war brewing with China, rising interest rates (at least nominally), a $1.3 trillion spending bill and simply being 9 years into a bull market–this could make for the start of a larger selloff into a new bear market.
From a technical perspective this correction has been more violent than previous ones. In the first 18 days of trading in 2018 all but 14 were positive and the S&P 500 rose 7% from 2,682 up to 2,872 only to reverse and over 10 days (only 2 of which were positive) drop down 11.8% to 2,532.
I think it is fair to say that is one of if not the most violent rise and reversal since the 2009 lows.
The 2008-2009 crisis saw a 57% stock market crash. A similar drop from the new high would result wipe out 7 years of gains.
I don’t think the US Federal Reserve will let the markets drop 57%. I think they will cry uncle if there is a 40-50% drop, they will freeze all rate hikes and may even start lower rates again.
Gold and emerging markets should do very well in this environment.
Monday Market Rally
The S&P 500 opened up at 2601 this morning and went up to 2661 and closed near the highs at 2658.
Gold did not sell off however, it actually rose to near the highs of the year.
We’ll see if gold can breech the resistance that has thwarted a larger rally for the yellow metal this year.
As previously mentioned the S&P 500 has dropped like this before. It hasn’t been this rapid before. But given additional negative factors, perhaps most significantly rising interest rates. I believe this could be the start of a larger correction.
I certainly don’t know for sure, if I had a crystal ball I’d be much richer than I am now. But it is important to be diversified in non-correlated alternative investments.
Over the past few weeks I’ve been writing about the faulty wiring in the United States economy that will eventually result in an Economic Conflagration.
The faulty wiring that will ultimately lead to this economic firestorm includes the fact that the real economy is weak, the economy is crushed by profligate debt and that stocks are overpriced and due for a significant crash.
One of the reasons why candidates such as Bernie Sanders and Donald Trump were popular in the last United States presidential primary and general election is because people know that the real economy is weak. They know how much debt they have and they want someone to make radical changes and do something about it.
Unfortunately government has never been particularly good at creating wealth or prosperity.
Some people might choose to rely on politicians to fix things. This website is not for those people. HowIGrowMyWealth.com is for people who want to take some common sense steps to grow and protect their wealth.
Given the faulty wiring the economy it is more important than ever to grow and protect one’s wealth. It might take a while but this faulty wiring will eventually result in a fire that will burn uncontrollably.
I realize this isn’t necessarily very cheery stuff but fear not! There is plenty of room for optimism.
I’m not a doomsday “prepper” or perma-bear and I’m sure that entrepreneurs, if free to do so, will rebuild the economy and usher in greater prosperity that will not be funneled to the politically connected.
I’m also cognizant that the stock market has gone up nearly 300% since the great recession, there hasn’t been hyperinflation in consumer prices and on the surface the crisis seems to have passed long ago. I don’t have a crystal ball and being right early sometimes looks like being wrong.
Despite the relative calm there is faulty wiring in the economy and sooner or later it will spark and ignite blaze that will, to quote Peter Schiff, “will make the financial crisis of 2008 look like a Sunday school picnic.”
The politicians, if they even realize that there are systemic problems in the economy, simply aren’t willing to endure the short term pain and inconvenience of ripping out the faulty wiring in order to fix the underlying problems. So they will continue to kick the can until the economic house burns down.
The bright side is that this will present an opportunity to rebuild the economy based on a strong foundation as opposed to what we have now, a phony economy based on debt, cheap money and consumption.
There will be winner and losers. I’m very optimistic about the future and I want to be counted amongst the winners.
So where am I putting my money?
My asset allocation falls into three main areas. Value stocks, gold and cash.
Value Stocks
Most people love buying things on sale and getting a great deal, expect when it comes to investing. When it comes to investing people want to buy expensive things and hope they go higher. Value investing takes that same common sense, buying things when they’re on sale and applies it to stocks and other asset classes.
The stock market as a whole is overvalued by a variety of metrics. But there are still good deals out there especially in non-US markets. I don’t doubt that value stocks will also go down in the event of a stock market crash but I think they will go down less and they will recover with more strength.
I share my value stock picks publicly. But I only share if I would buy them today or if I would hold or add to my positions with members of my free email newsletter. I will also let me email subscribers know when I buy or sell a stock first, before I publish that information to this website.
Gold
I don’t think you will get rich buying gold but it could prevent you from getting poor. Under relatively normal circumstances the demand for gold is fairly steady and the supply is fairly steady so for the most part the price of gold will rise with the level of inflation.
Gold is a way to save purchasing power. It’s a way to opt out of the financial system and wait for sanity to return.
If the dollar tanks loses it’s reserve currency status gold will still be valued.
I also think there has been significant effort to suppress the price of gold and depending on how much downward price manipulation there really has been, the price of gold could go up significantly from where it is right now.
If fiat currencies collapse that could very well induce a flight to the safe haven asset of gold that this influx of demand would be very bullish for gold.
Because of the absurd expansion in central bank balance sheets and artificially low interest rates I like gold presents a fantastic value at current prices.
What I write about gold applies to silver–another asset I think will do very well in a downturn. Silver has the added benefit of being an industrial metal that is more widely consumed.
Cash
Long term, like every other fiat currency, I think the dollar will go to zero. So why would I want to hold dollars?
First, I own a month or two of expenses in physical cash in a secure location in case there are capital controls. If there is a panic and people start withdrawing money from the banks the banks might in turn say, you can only withdraw $500 a week or something like that. Withdrawal limits could also be imposed if the US implements negative interest rates and people (very rationally) decide it is better to hold dollars in physical cash so they don’t have to pay interest to their bank for the privilege of loaning their money to the bank.
I reside in the United States and everything is priced in dollars so I need dollars to buy things. If I lived in the eurozone I would hold pounds or euros, if I lived in China I would hold Yuan. If I lived in the socialist paradise of Venezuela I would probably hold dollars (and try to get out).
Secondly, apart from physical cash I also hold dollars in a money market fund as a war chest. If stocks tank I expect there will be bargains to be had. I want to be buying stocks (if they are high quality free cashflow producing companies) when everyone is panicking and selling.
Now I fully expect the United States Federal Reserve to do what it has done in all other crises it has created–it will lower interest rates and buy assets to prop up the markets.
With interest rates already low once they cut rates to zero they will only be able to do things like Quantitative Easing and Negative rates. This is very bearish for the dollar and very bullish for gold.
But in the highly unlikely chance the US Federal Reserve does the right thing and lets the stock market collapse and lets the US government default on it’s debts this could be very bullish for the dollar. So holding some dollars is a hedge against deflation as well as a war chest to draw upon to buy undervalued stocks post crash.
What are some other possibilities?
While the bulk of my holdings are in cash, value stocks and precious metals I also dabble in some other alternative investments.
If there is a dollar crisis or collapse in the faith of central bankers then more people could turn to cryptocurrencies and could see it rise. Demand for cryptocurrencies could also rise for other reasons pushing the price upwards.
While I think blockchain technology is here to stay the value of any one specific cryptocurrency or token could very easily tank to nothing. Cryptocurrencies are very risky and 90% swings (both directions) happen.
You need to have an iron stomach but having between 1-5% of your liquid net work in cryptocurrencies isn’t the most outlandish idea in the world.
I would only speculate on cryptocurrencies with what you can afford to lose and I don’t considering buying cryptocurrencies investing in a technical sense since I am simply betting on the price going up.
I’ve shared with my readers my Group of Six cryptocurrencies that I’ve chosen to own and speculate on.
Options
Net I’ve actually lost money trading options. I traded options while unemployed and failed to remain dispassionate and objective. I was so focused on making money that I opened positions when the conditions were not ideal and took risks I should not have been taking.
I do believe if you are disciplined and follow the appropriate rules, you can do well trading options.
During a stock market crash volatility spikes and selling options could be a good strategy. When the VIX (a volatility index) spiked up in early February I sold a few options and those positions are doing well as volatility has dropped and the market has recovered. Markets don’t move straight up or down for very long so even if the February selloff portends drops to come, the market doesn’t drop as fast as people think in the midst of the drop.
Real Estate
Unlike all the other assets mentioned above I do not and never have owned any real estate.
Lots of people have made lots of money in real estate. I am working to learn more about this asset class and hope to own my own rental property at some point.
What I like about real estate is that it is easy to use leverage and the tax benefits are ridiculous. You can effectively pay no tax on investment property income and borrow a lot of the money you need to get started.
You of course need to know what you’re doing.
My goals for owning real estate involve owning a multi-family apartment building. The key for me is a cashflow positive property. I don’t have any interest in trying to buy and flip, although some people are very successful doing this. There are lots of ways to make money in real estate and I recommend biggerpockets.com to learn about them.
I think cashflow positive real estate will do okay in the event of a crash. If you’re in an area that has stable employment prospects those workers will always need a place to live and have the money to pay for it. Of course real estate won’t “always go up” and there are a lot of risks and headaches associated with managing property (if you don’t outsource property management).
This is part 5 of 5 of what I’ve decided to term The Economic Conflagration series where I discuss the faulty wiring pervasive the global economy:
This website uses cookies to improve your experience. We'll assume you're ok with this, but you can opt-out if you wish.AcceptRejectRead More
Cookie Policy
Privacy Overview
This website uses cookies to improve your experience while you navigate through the website. Out of these, the cookies that are categorized as necessary are stored on your browser as they are essential for the working of basic functionalities of the website. We also use third-party cookies that help us analyze and understand how you use this website. These cookies will be stored in your browser only with your consent. You also have the option to opt-out of these cookies. But opting out of some of these cookies may affect your browsing experience.
Necessary cookies are absolutely essential for the website to function properly. This category only includes cookies that ensures basic functionalities and security features of the website. These cookies do not store any personal information.
Any cookies that may not be particularly necessary for the website to function and is used specifically to collect user personal data via analytics, ads, other embedded contents are termed as non-necessary cookies. It is mandatory to procure user consent prior to running these cookies on your website.


