
by John | Jun 11, 2017 | Capital Appreciation, Investor Mindset, Investor Psychology, Value Investing
I really enjoy baseball. It’s a great game. No timers, no clocks. The winning team has to get the losing team out at least 27 times.
A great movie about baseball is Moneyball. This film was released in 2011 and it’s about a small market team, the Oakland Athletics, and how they are having trouble competing against large market teams (like the New York Yankees) who have larger budgets and are able to pay more money for the best players. The story focuses around the Oakland General Manager, Billy Beane (played by Brad Pitt), and his quest to find a way to recruit players to form a winning team even though they can’t afford to pay the higher salaries the top talent requires.
Beane finds Yale graduate Peter Brand (played by Jonah Hill) who uses a system for evaluating players based on math. It’s a more scientific approach to player evaluation. Using metrics like on base percentage rather than a traditional batting average and looking beyond things like unorthodox pitching style or age and focusing strictly on performance they are able to find value in players that other people overlook.
Moneyball is based on a true story and the metrics they use are based on the “Sabermetrics” pioneered by Bill James and others.
It’s essentially applying the concept of value investing to baseball. While Billy Beane and Peter Brand looked for undervalued players who would get on base, get runs, and help Oakland win baseball games, value investors look for undervalued stocks that will produce earnings, positive cashflow and make an investor money.

by John | Apr 9, 2017 | Capital Appreciation, Currencies, Liquidity, Trading
I’ve written about why I dislike cryptocurrencies. Everything I’ve written there is an accurate conveyance of my views.
However, today I’d like to write about why I like cryptocurrencies (and blockchain technology). I don’t see these views as contradictory, simply pragmatic.
If you aren’t already familiar with terms like blockchain, cryptocurrency or Bitcoin check out this explanation: What is Bitcoin?
Let me give you an example to illustrate why it doesn’t really matter if there are things I dislike about cryptocurrencies. If you know a lot about art this won’t work. Lets say I created the following piece of artwork. Say it’s something I painted when I was in seventh grade.
I try to sell it. How much do you think it would go for?

I’m guessing somewhere between nothing and a few bucks. Personally I don’t think it is very good. I don’t like it that much. The paint and canvas could be purchased for a few dollars but they might be worth more unused.
But guess what, it’s actually a Pablo Picasso painting called “Femme Assise” and someone paid $63.7 Million for it in 2016.
Source: https://www.nytimes.com/2016/06/23/arts/design/picassos-femme-assise-sells-for-63-7-million-an-auction-high-for-cubism.html
I don’t particularly care for this piece of art but people are willing to spend millions for it. So If I knew a lot about art and spotted an original Picasso at a garage sale for $20 I would buy it knowing I could sell it to someone else for much higher.
Just because I don’t particularly like much of Picasso’s artwork doesn’t mean it isn’t highly valued by other people. Just because I think there are fundamental flaws with cryptocurrencies that prevent it from being a good long term store of value doesn’t mean they won’t rise in price–at least in the short to medium term.
Whenever money is pouring into a sector or industry that is an opportunity for profit. And so I view cryptocurrencies as a speculation rather than an investment. But given all of that there are several things I like about cryptocurrencies.
1) Cryptocurrencies are great for Speculation and Trading
On 28 April 2013 the market cap of all cryptocurrencies was $1.59 billion. It’s currently nearly $28 billion.
Source: https://coinmarketcap.com/charts/
That is a tremendous inflow of money in a period of just four years. Cryptocurrencies are a rapidly growing market and it’s easy to pick a winner when everything is going up, wether it is stocks or cryptocurrencies.
The price of cryptocurrencies also tends to fluctuate dramatically and that sort of volatility is great for trading.
2) Cryptocurrencies aren’t Controlled by the Government
I’m sure some people go into government because they want to do good and make a positive change in the world.
However, on the whole government, at least in the United States, seems to mainly work to perpetuate itself. One way the US government has been able to stay in power is by going into debt and printing money.
This has resulted in a significant devaluation of US dollars.
While I think most cryptocurrencies are fairly centrally controlled the people in control of these cryptocurrencies have motivation to work for the long term good of the currency and technology since there are hundreds of other cryptocurrencies out there that people could easily adopt instead.
I think the inspiration and popularity of cryptocurrencies is at least in part due to this reckless government spending which is itself inflation and the cause of price inflation.
Many (but not all) of the cryptocurrencies including the largest, Bitcoin, are designed to be deflationary in nature.
3) Potential Widespread Adoption
A cryptocurrency or blockchain technology could be widely adopted as a replacement for one or more parts of the legacy financial system.
A Replacement for Dollars or Euros or Yen…Etc
While billions of dollars have flown into cryptocurrencies over the past several years there still isn’t widespread adoption by consumers. You don’t go into the local quick mart to pay for gasoline with DASH or Bitcoin. Amazon.com doesn’t accept Monero or Zcash as payment.
Spending dollars online and in the brick and mortal world using technology like Paypal or simply a credit card works great. The technology for spending fiat currency is mature and works fine in most use cases.
An Outside Catalyst
For some reason the average consumer in America (and perhaps people around the world too) doesn’t really about inflation, at least not directly. They care their rent goes up each year and things are getting more expensive, but they don’t think about the cause of rising prices (other than unfairly blaming “greedy business owners”).
Right now inflation is “only” 2-8% per year. Even though that represents a tremendous loss of purchasing power over time it is low enough that people aren’t really concerned about it. As long as price inflation is relatively low and stable I think people will continue to use government issued fiat currency.
But if inflation really started to take off (as I think it will some day) I anticipate the appeal and adoption of cryptocurrencies would take off as well and with it the price.
Weakest Elements of the Legacy Financial System
However international wire transfers are rather slow and somewhat expensive. And I’m not aware of an online cash-like payment system that existed before Bitcoin. So international settlements and online cash-like transactions are two areas within the legacy financial system that leave room for cryptocurrencies and blockchain technology to step in as a superior alternative.
Blockchain technology like Ripple, which has been sponsored by numerous large banks around the world, could very well replace certain elements of the international financial system.
Cryptocurrencies like Zcash and DASH, which are better than Bitcoin when it comes to speed and privacy, could very well gain large marketshare as a way to make cashlike transactions online.
4) Blockchain technology
In addition international settlements there are a variety of other applications for which Blockchain technology, one of the fundamental technologies behind cryptocurrencies, could be transformative. Areas like stock ownership, smart contracts, digital voting, and cloud storage could be revolutionized by blockchain and cryptocurrencies.
Cryptocurrencies and Blockchain Technology
I don’t see these technologies going anywhere. They could very well revolutionize many sectors in the financial world.
For all the reasons I’ve listed before, I don’t know that buying into a cryptocurrency is going to be a good long term store of value.
However, the technology itself is powerful and there is the potential for profit if one makes some daring (and correct) speculations.
by John | Mar 5, 2017 | Asset Allocation, Capital Appreciation, Value Investing
Stocks are one of the key ways I grow my wealth.
I like value investing and value stocks. It’s not some aesthetic or subjective reason. As an asset class US value stocks have a history of outperforming other US stock classes.
I like picking individual stocks but I appreciate that is not suitable for everyone. For some folks a passive index asset allocation strategy could be better.
Equally Weighted Large, Mid, and Small Cap Portfolio Performance Since 1972
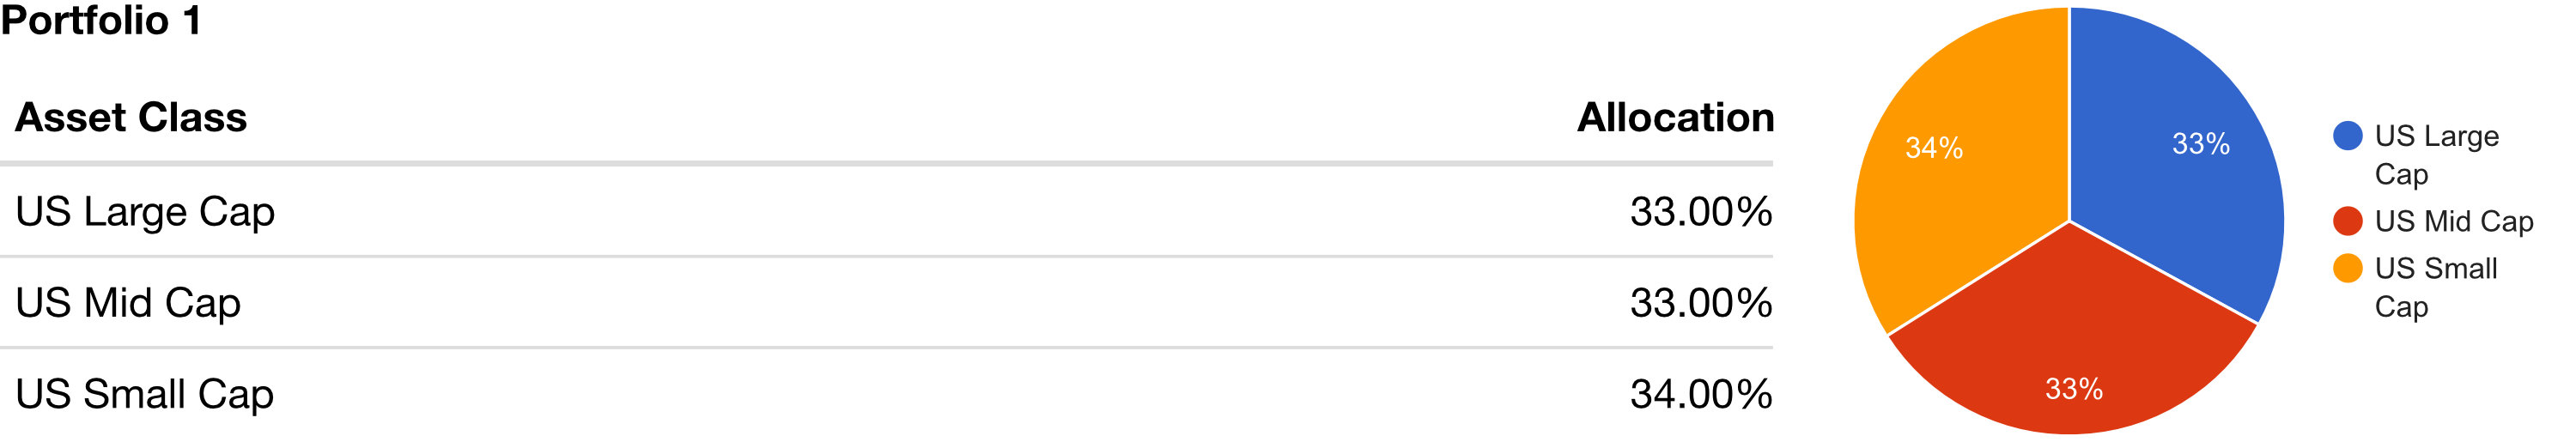
If one were to have invested $1,000 in the a portfolio consisting of roughly equal allocations of large market capitalization (“Large Cap”) stocks, mid-cap and small cap stocks in January of 1972, it would have grown to $132,330 by January of 2017. The compound annual growth rate (CAGR) of this portfolio was 11.45%. The maximum drawdown around the 2008 financial crisis was 52.70% (stressful).
During this same time, if one were to invest $1,000 in “US Stocks” the CAGR would have been 10.21%, balance on January 2017 would have been $80,008, and the maximum drawdown would have been 50.89%.
Source: portfoliovisualizer.com
What about Growth Stocks?
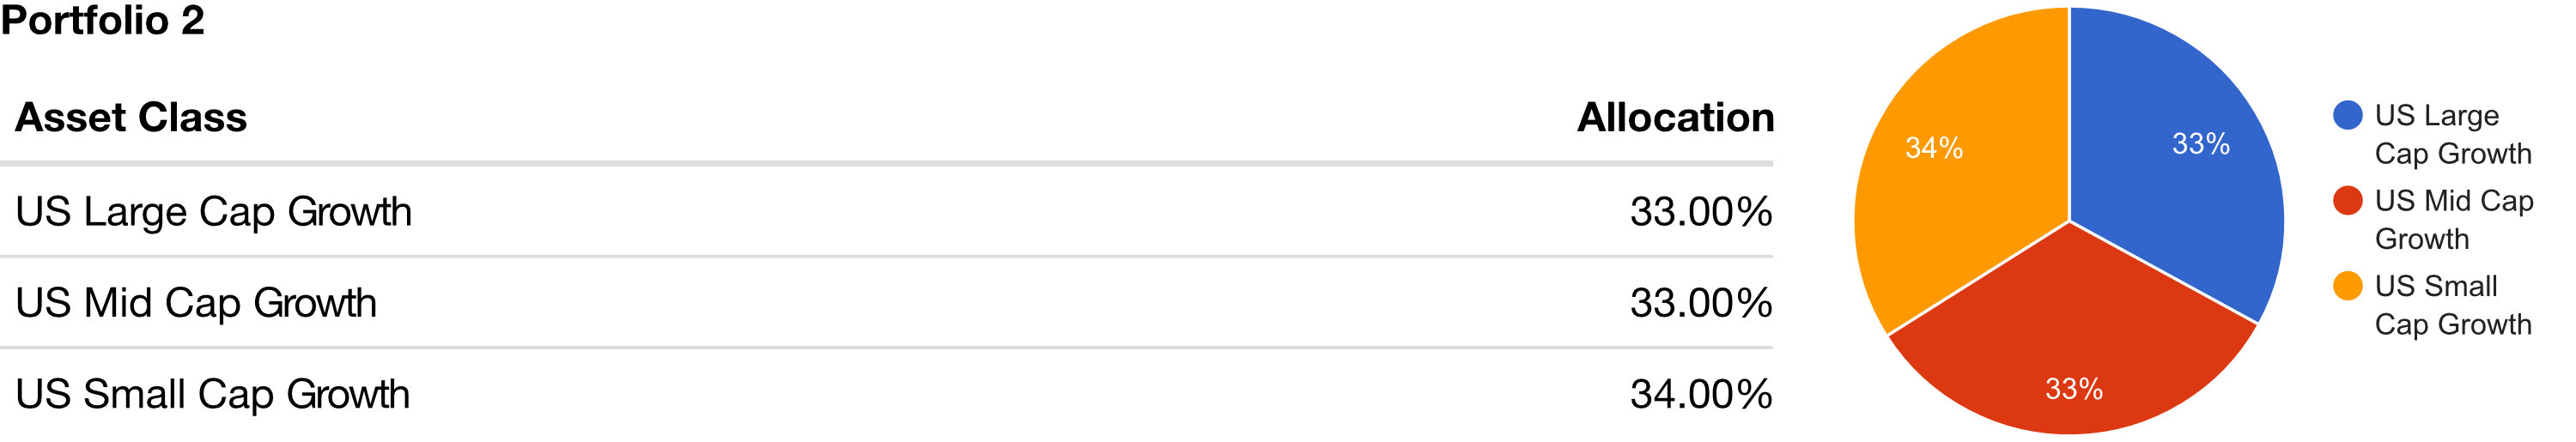
A portfolio with 1/3 large, 1/3 mid and 1/3 small cap growth stocks would have done even worse than the allocation above. The CAGR since 1972 has been 10%, the maximum drawdown was 58.6% (wow!), and $1,000 would have grown to $73,508.
So growth stocks performed worse.
Source: portfoliovisualizer.com
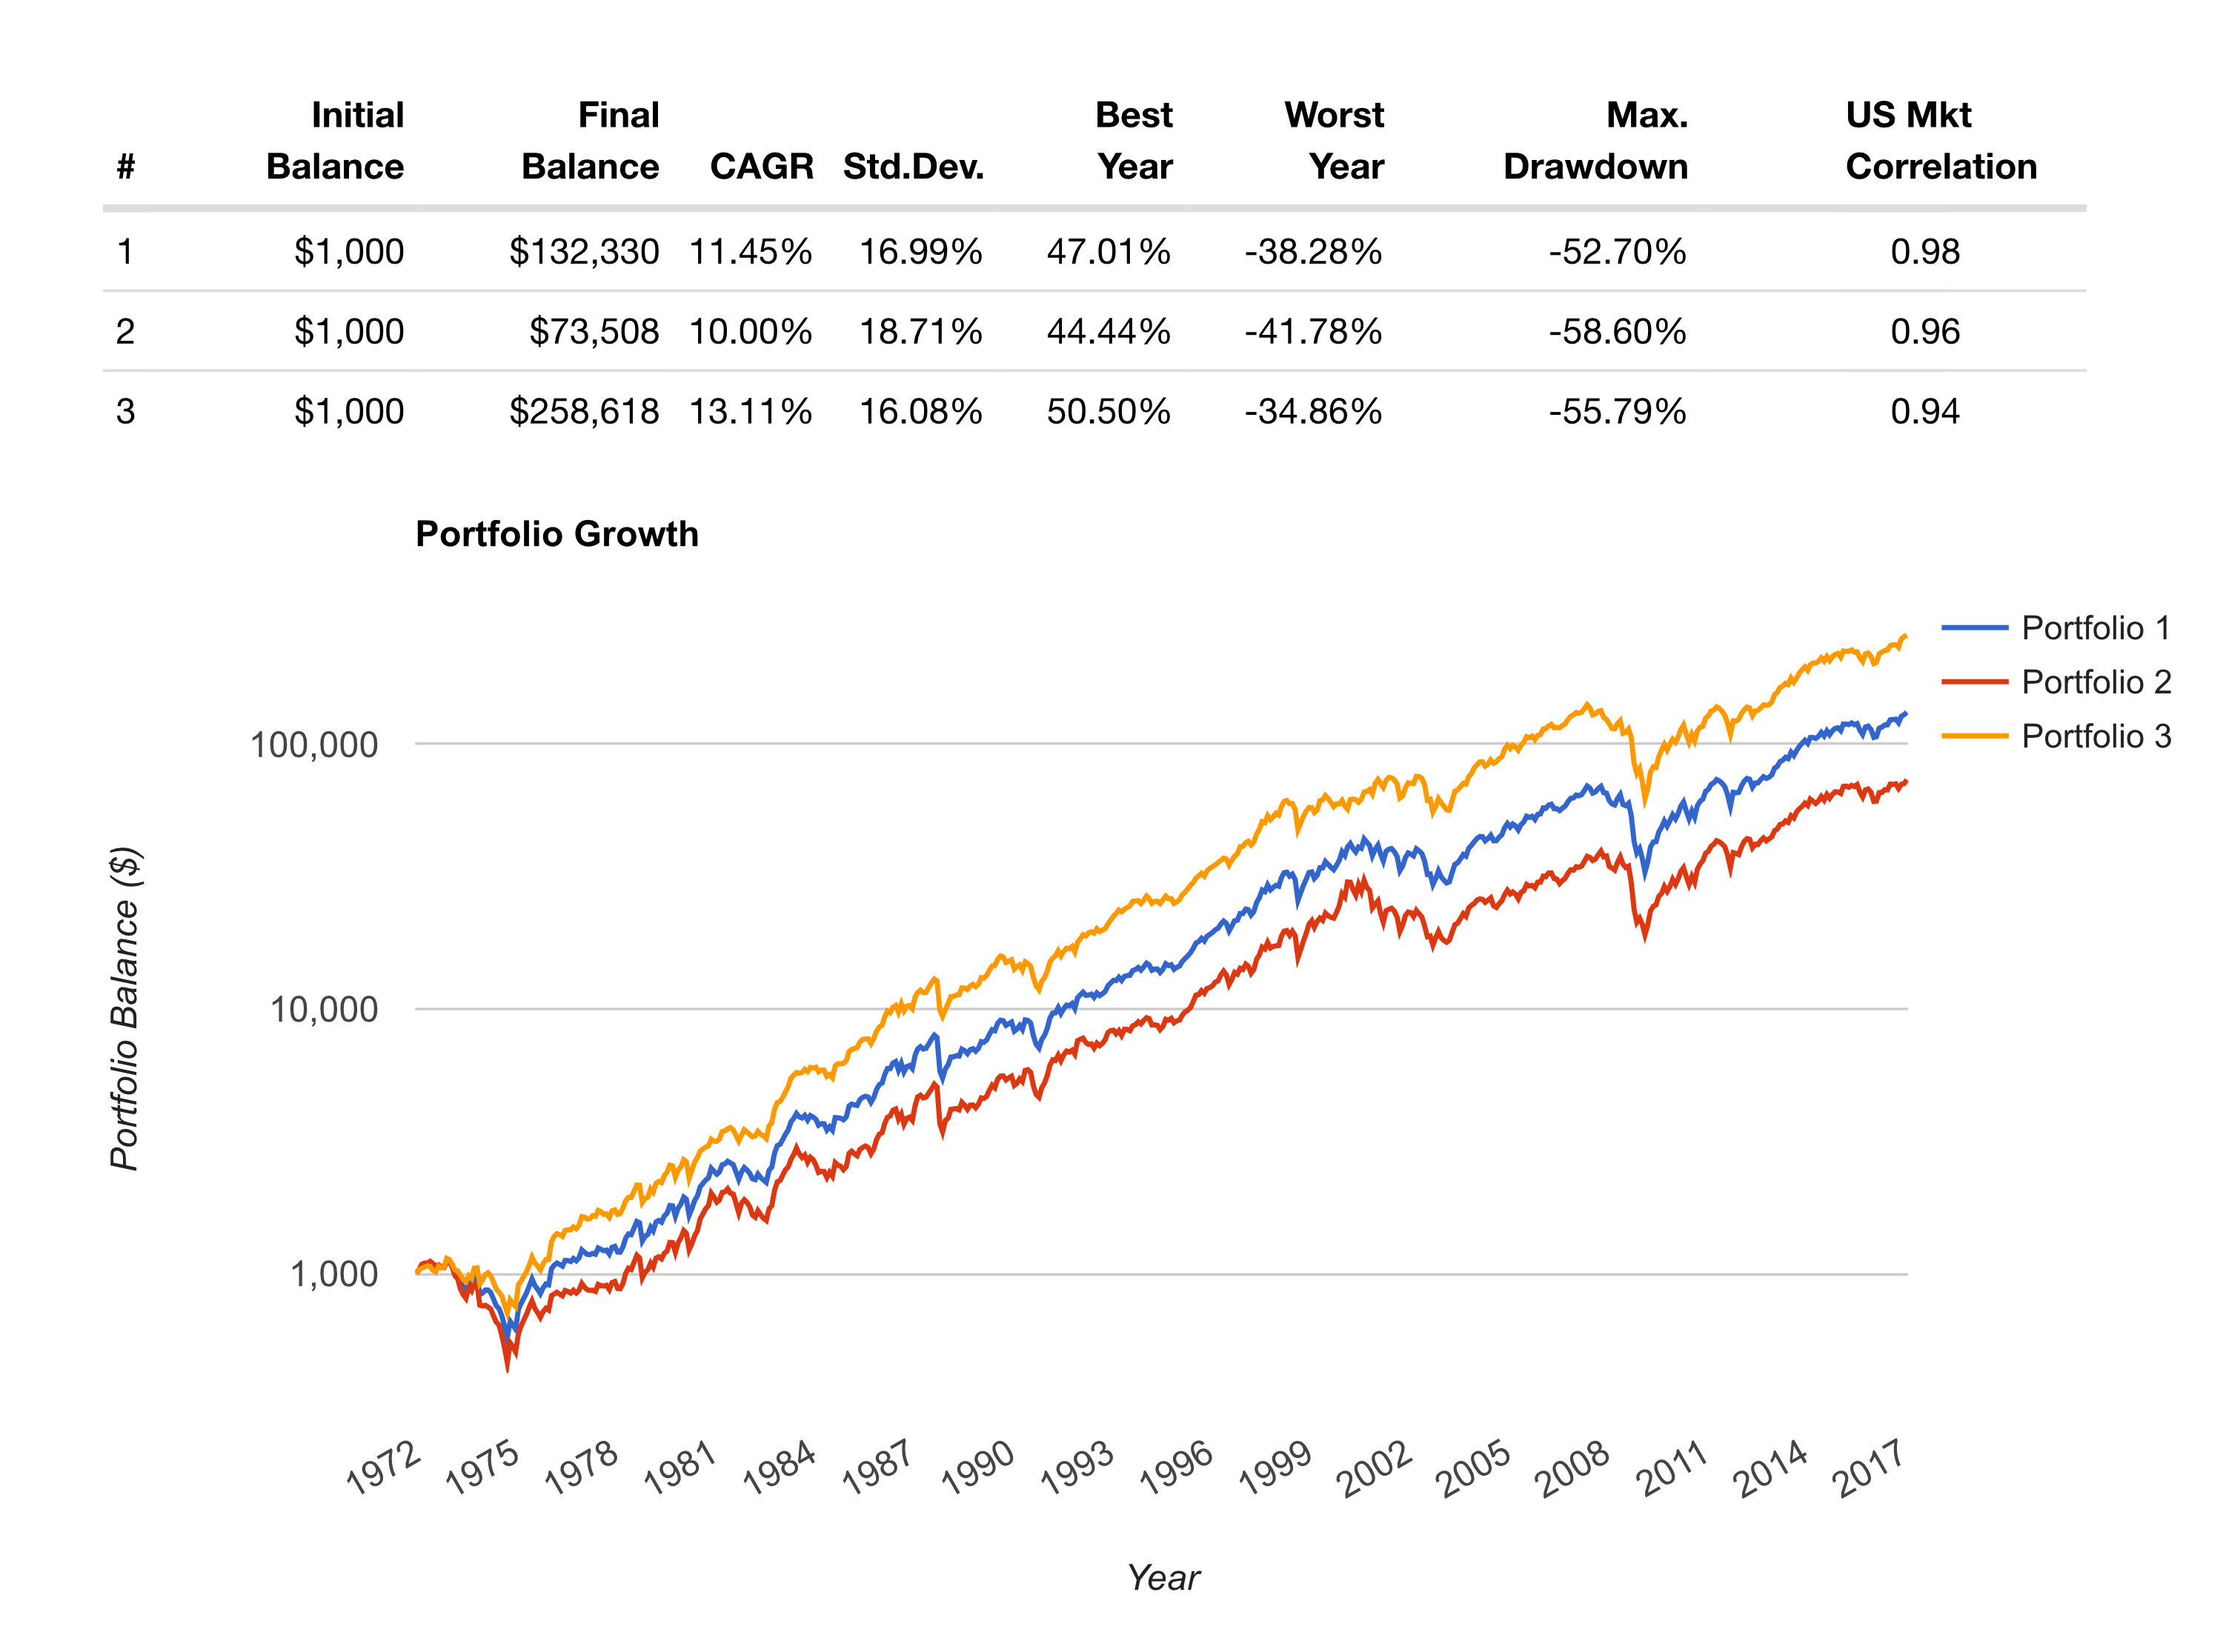
US Value Stocks have Outperformed

US value stocks have outperformed growth stocks. A portfolio mixed with 1/3 large cap value, 1/3 mid cap value and 1/3 small cap value would have a CAGR of 13.11%.
A $1,000 investment in 1972 would have grown to $258,618. The maximum drawdown would have been slightly higher than straight market cap stocks, at 55.79% (still stressful) but less than the growth stock portfolio.
Source: portfoliovisualizer.com
What it All Means
There are two main takeaways.
- Value stocks outperform other stocks classes
- A small increase in the CAGR has a large impact if the time horizon is long enough
- US value stocks had a lower maximum drawdown than growth stocks
- US value stocks have higher maximum drawdown than stocks in general
Source: portfoliovisualizer.com
For more details on this data see the portfoliovisualizer.com FAQ.
by John | Feb 26, 2017 | Capital Appreciation, Geopolitical Risk Protection, Preservation of Purchasing Power, Wealth Protection
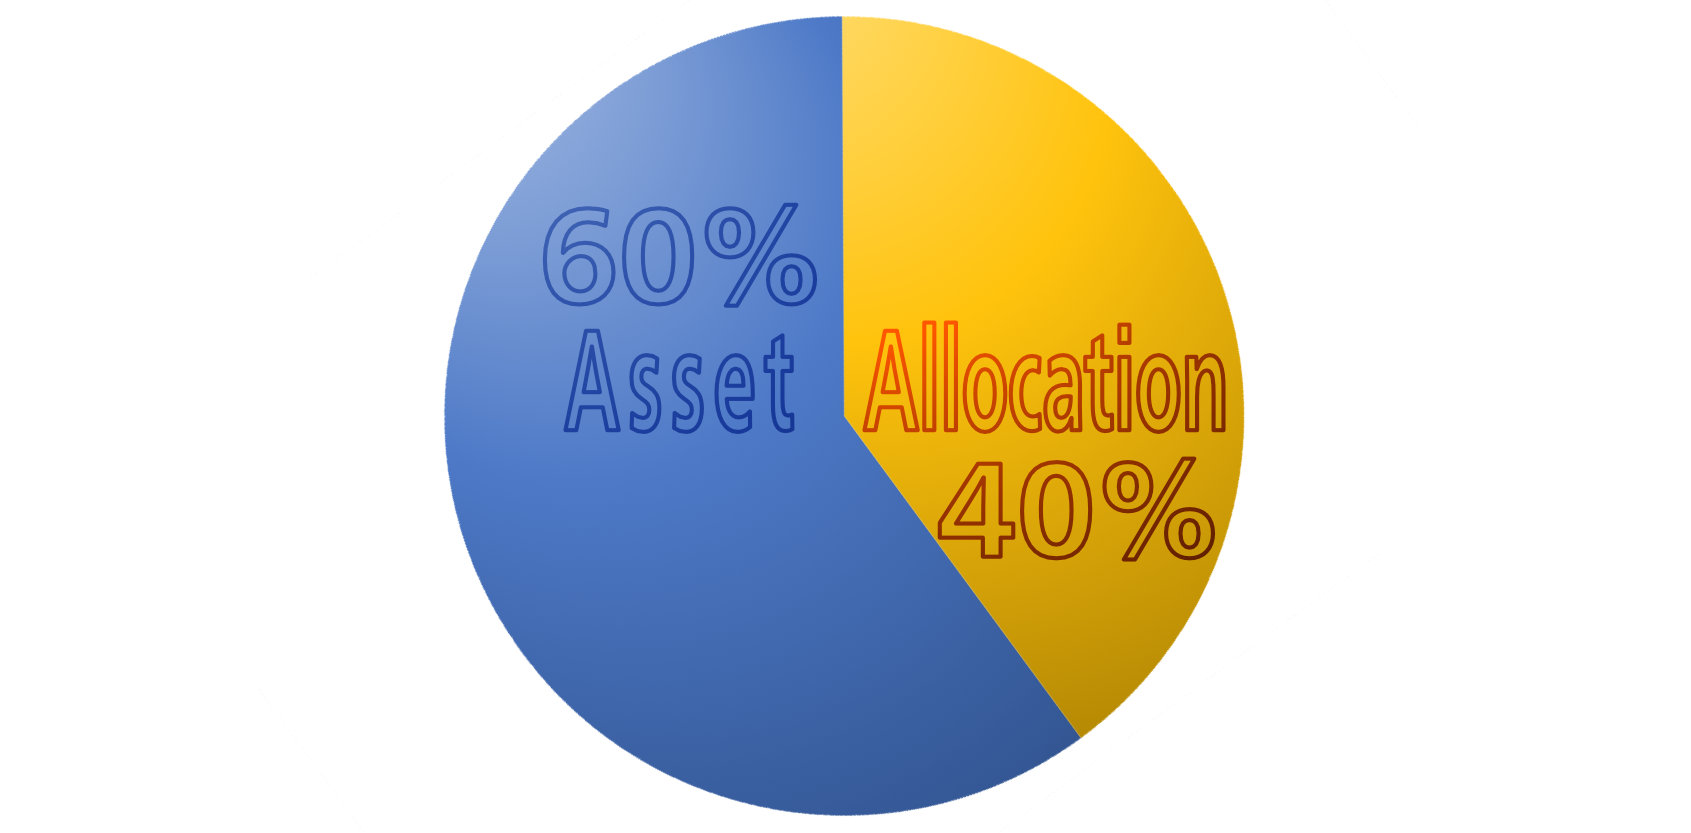
What is a 60/40 asset allocation? I’ll take a quote from an article on my favorite online finance wiki, investopedia:
For many years, a large percentage of financial planners and stockbrokers crafted portfolios for their clients that were composed of 60% equities and 40% bonds or other fixed-income offerings. And these portfolios did rather well throughout the 80s and 90s. But a series of bear markets that started in 2000 coupled with historically low interest rates have eroded the popularity of this approach to investing. – “Why a 60/40 Portfolio is No Longer Good Enough“
With that in mind, I’ve found a delightful free tool called Portfolio Visualizer that I’ve been using to backtest various asset allocation strategies.
Today I’d like to share a few basic ones to provide some food for thought. Each of these portfolios is modeled for annual rebalancing, meaning assets would be bought and/or sold each year to retain the original allocation percentages.
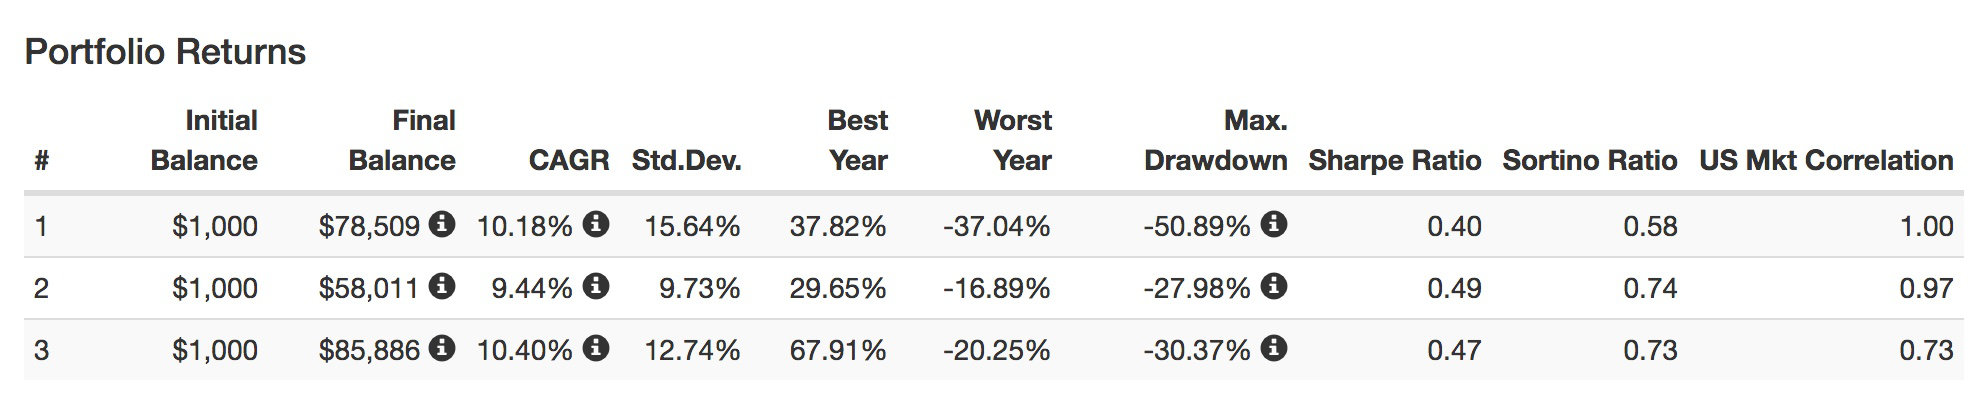
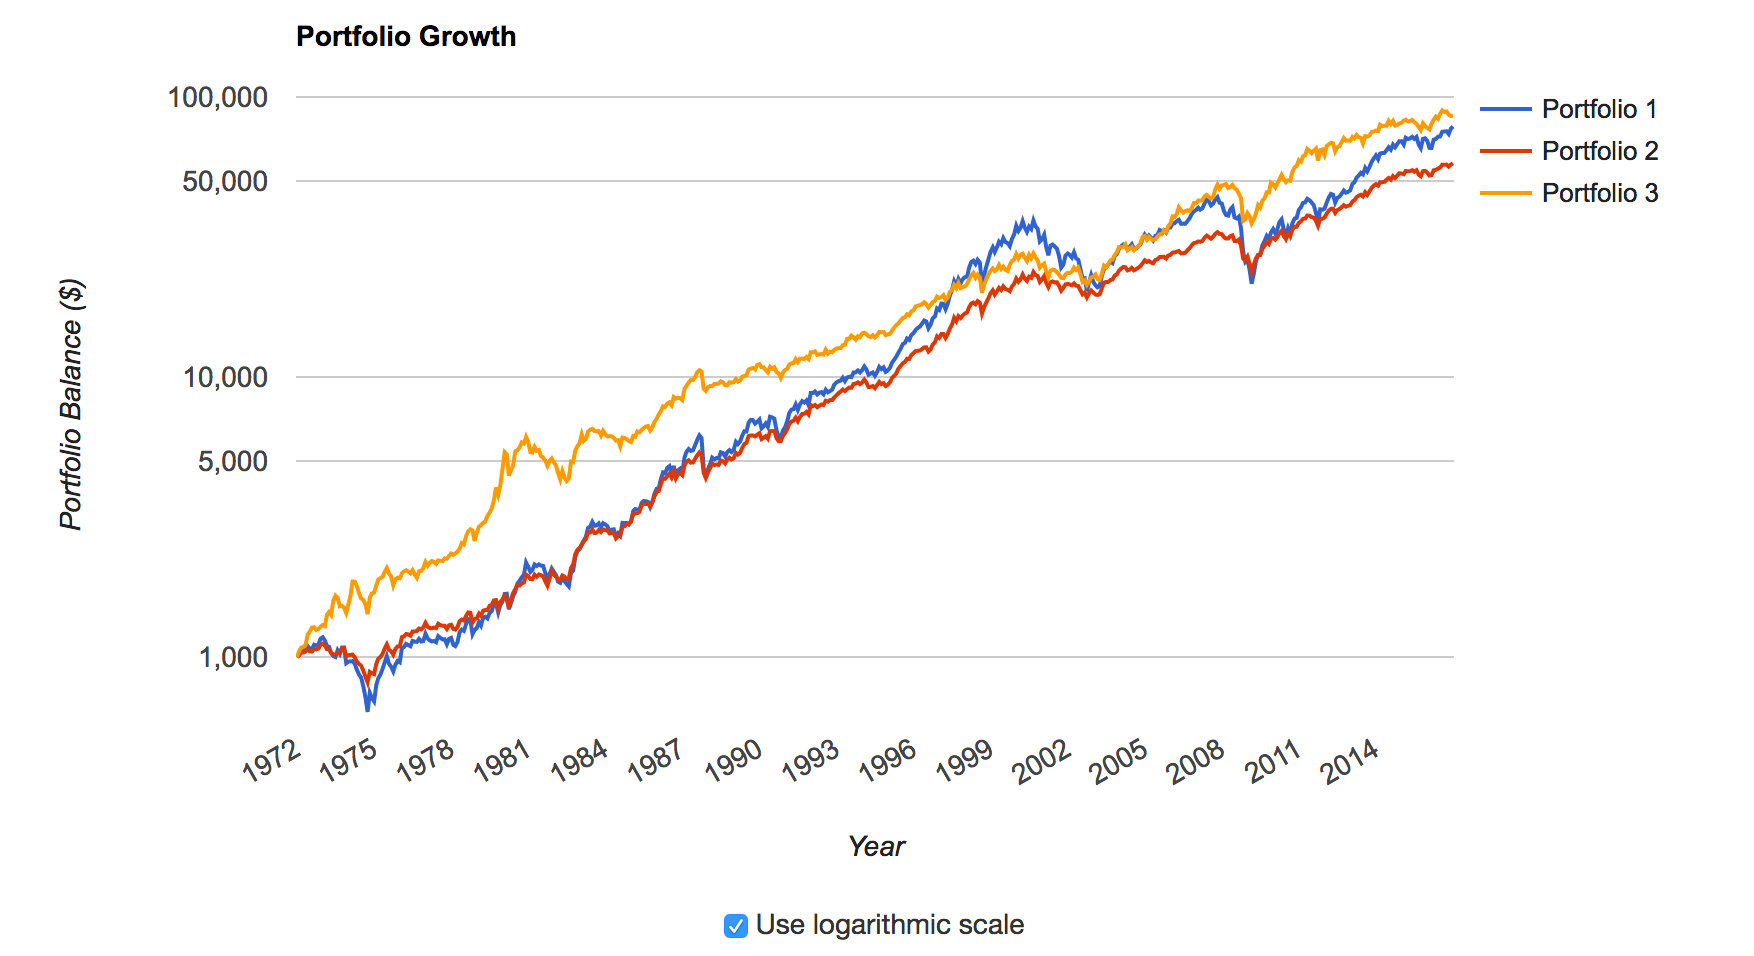
Portfolio 1: 100% Allocation to US Stocks
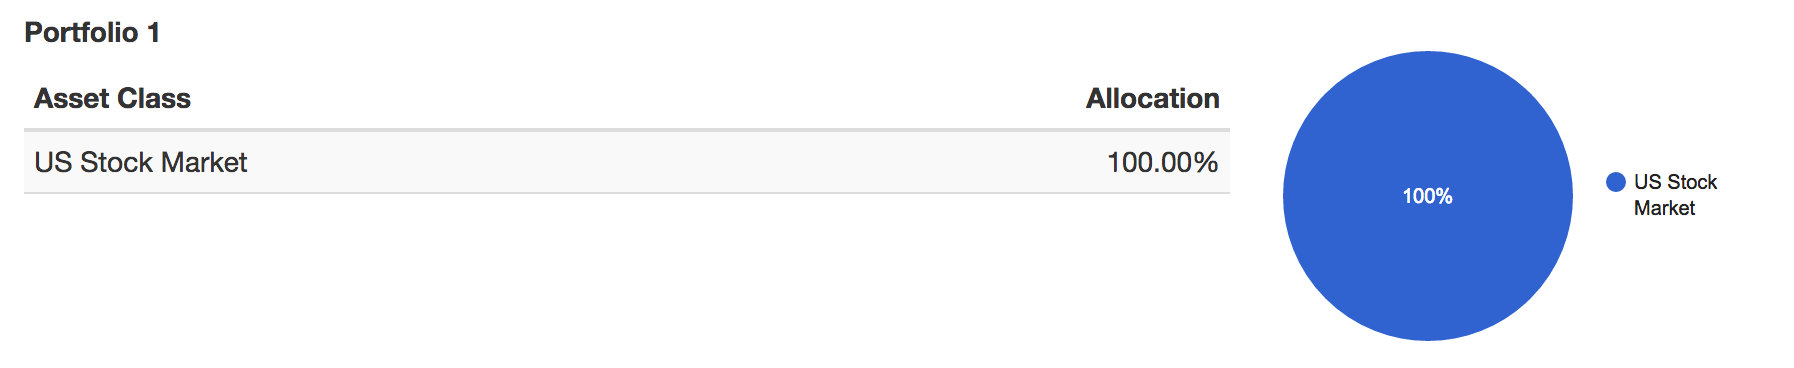 Using this tool, you can see that if in 1972 you invested $1,000 in US stocks, it would grow to be worth $78,509 at the end of 2016, representing a compound annual growth rate (CAGR) of 10.18%. You would have had to endure a drawdown of 50.89%, from November of 2007 through February of 2009. During this crisis the portfolio would have gone from $43,886 down to $21,551.
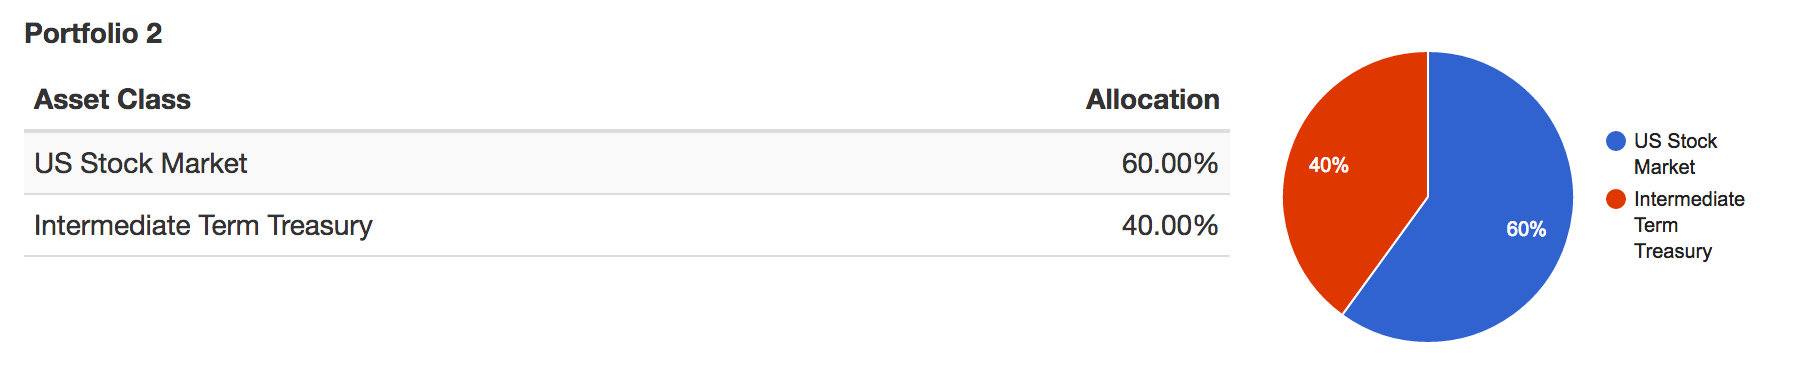
Portfolio 2: 60/40 Asset Allocation of US Stocks and Bonds
 Most people don’t have the iron stomach needed to hold onto their stocks while their portfolio drops by 50%.
Enter the 60/40 asset allocation.
A traditional allocation in the investment community is (or has been) 60% stocks 40% bonds (in this case I used Intermediate Term Treasuries). The thought being that if stocks are going up, bonds are going down, but also that if stocks are going down, bonds will go up. If you did this 60/40 allocation starting in 1972, again with $1,000, the 2016 value would be $58,011, the CAGR would be 9.44% and the 2008 drawdown would have been around 28%.
So you give up $20,500 in exchange for some peace of mind.
Portfolio 3: 60/40 Asset Allocation of US Stocks and Gold
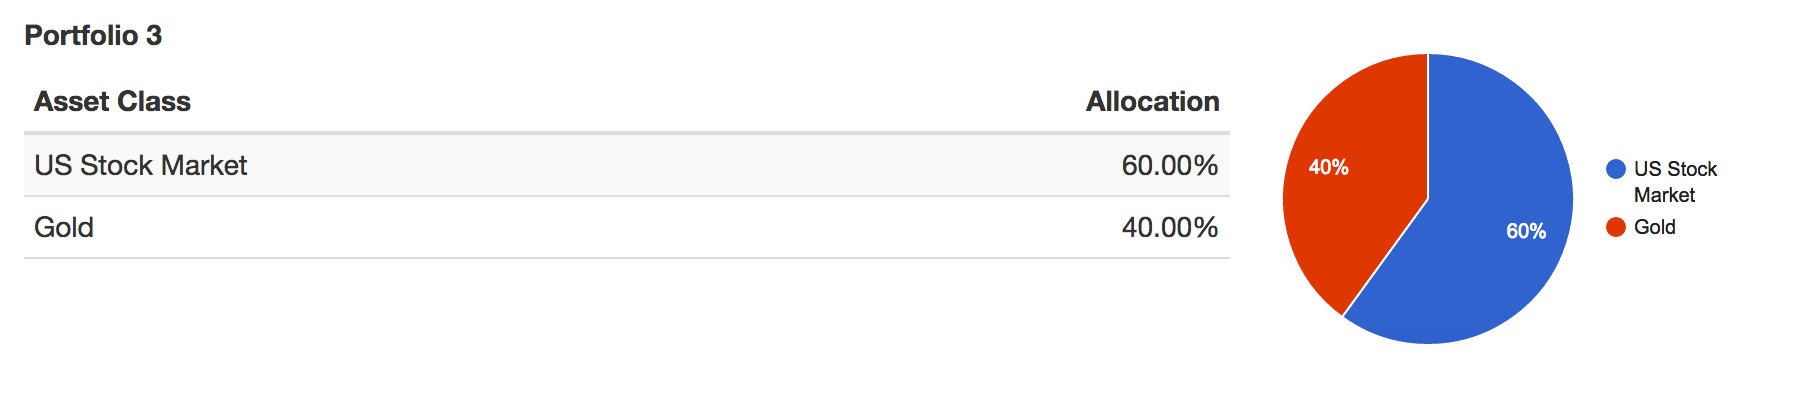 I think that US debt has nowhere to go but down. And I’ve never been particularly fond of loaning the government money, through treasuries or otherwise, so I thought: what if one replaced the 40% allocation to bonds with my favorite yellow metal?
With this allocation the $1,000 invested in 1972 would grow to $85,886 by 2016, the CAGR would be 10.40% and the maximum drawdown would have been 30% back in 1980-1982.
So over the 1972-2016 timeframe, a 60/40 asset allocation of US stocks and gold would have performed better than either 100% US stocks or a 60/40 US stock and bond portfolio.
You can always cherrypick allocations in hindsight that will outperform. But I think it is an interesting datapoint in the case for gold.

by John | Feb 12, 2017 | Capital Appreciation, Value Investing, Wealth Protection
Imagine if you will your fairy godmother appears and you’re given the opportunity to backdate one trade to five years ago.
You’re given 1,000 dollars and you’re presented with three investment choices.
For each option she tells you the annual gain or loss as well the average return:
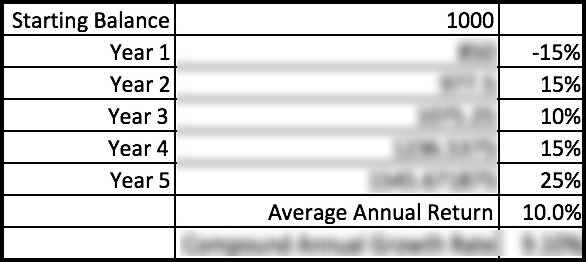
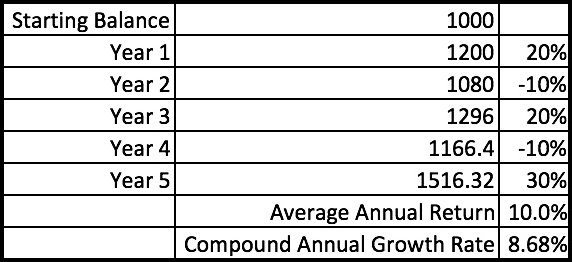
Investment One
Investment Two

Investment Three
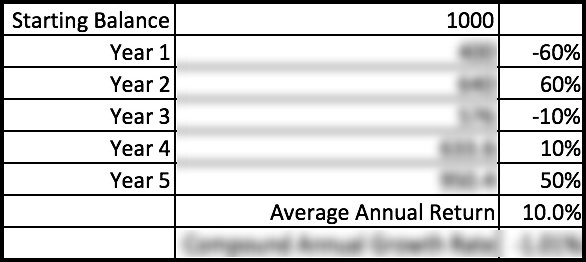
Now your fairy godmother told you the average annual return for each is 10%. So, one might be tempted to assume each investment will perform the same!
But you don’t get average returns so this number is not particularly useful.
Total Return
You want to choose the one that has the highest total return. Total return is just a fancy way of saying how much an investment went up (or down) from it’s starting value.
So you’d take the starting amount, $1,000, and add the gain or loss from the first year, second year, etc, and see how much the $1,000 is now worth after five years. The percentage increase from the original value to the ending value is the total return.
Total return would be 54.57% for investment one, 51.63% for investment two and lastly investment three has a total return of -4.96%, even though the average return for each was the the same: 10%.
Compound Annual Growth Rate
Investors typically want to know how an investment tends to perform each year. A useful way of seeing how an investment does each year in a way that smooths out up years and down year that is more useful than average returns is the Compound Annual Growth Rate (CAGR).
CAGR is calculated as follows:
Source: http://www.investopedia.com/terms/c/cagr.asp
I’ve calculated the CAGR for you below.
Investment One

Investment Two
Investment Three
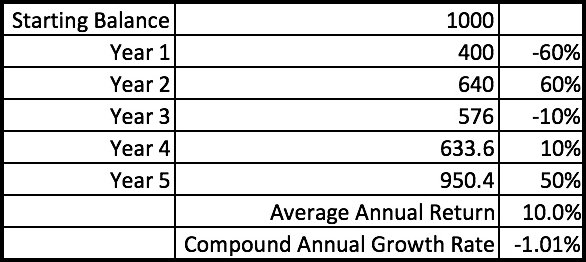
So if the fairy godmother had provided the CAGR; it would have a been a useful number to determine which investment had the highest total return.
Why Do fairy godmother’s overcomplicate things?
 Why wouldn’t your fairy godmother just give you an even $1,500 and call it a day?
I don’t know.
Cinderella‘s fairy godmother gave her until midnight to get back home. Why didn’t she give her a year to get back or just make the pumpkin turn into a carriage permanently?
Why weren’t the slippers made out of something more comfortable and durable than glass?
Cleary there is NOT a precedent for the pragmatic or straightforward. So don’t ask me to explain how fairy godmothers operate. But lest I upset the fairy godmother community I think the principle of don’t look a gift horse in the mouth also applies. After all, she’s hooking you up with the ability to backdate a trade.
You don’t get the Average Annual Return
At best the average return % isn’t useful. At worst the average return is rather deceptive–but that is the number that most mutual funds list.
While not without it’s limits, the compound annual growth rate is much more useful than average returns and it is something to keep in mind when evaluating an investment.
Average returns tell you very little while the compound annual growth rate shows you which investment would have had the highest total return.

by John | Jan 29, 2017 | Capital Appreciation, Stocks I Like, Value Investing, Wealth Protection
I don’t know how to time the market.
I wish I did.
If I could do marketing timing I would have bought US stocks in in the early 90s (I was pretty young but still!). Sold in early 2000, bought in October 2002, sold in October 2007, bought in March 2009.
That would be fantastic.
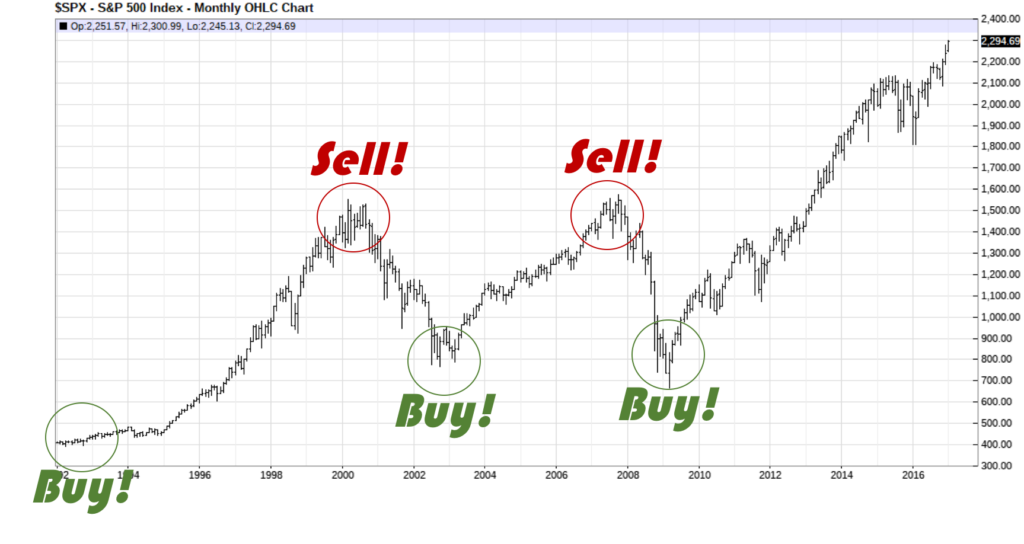
S&P 500 Market Timing Guide (Only Available in Hindsight)
Unfortunately I’m only good at timing the market in hindsight.
This of course isn’t useful, since my broker doesn’t let me backdate trades.
John: “[Phone rings] Hello, TD Ameritrade?”
TD Ameritrade: “Yes, this is TD Ameritrade.”
John: “I would like to buy 100 shares of the Vanguard S&P 500 Fund at the 1992 price.”
TD Ameritrade: “….[click]”
In all seriousness though, the above chart does say something about the long-term benefits of buy and hold (but you have to buy and hold for very long periods of time and suffer through large drawdowns).
But I’ve always wanted to do better than a long term buy and hold strategy. I think the best way to do that is through value investing.
US Stocks and Bonds are Overvalued
Today I was reading a MarketWatch.com article by Thomas H. Kee Jr. in which he states, “Ultimately, liquidity matters more than valuation to professional investors, and it is far more important to the market than any of the noise we are hearing.”
I think he is right insofar as what professional investors care about. The performance of US stocks since 2009 bears this out.
This is also supports my belief that US stocks and US bonds are in a bubble, the rise in price of these asset classes is based on liquidity (central bank money printing) and NOT valuations.
But if markets have anything to do with the real economy security valuations will eventually return to a market-based and realistic level of valuation regardless of central bank injections of liquidity.
Let me summarize what I’ve said so far.
1) Stocks and bonds are in a bubble due to central bank manipulation called “liquidity”
2) I don’t know how to time the market
In other words I know that stocks are overvalued but I don’t know when they will revert to a valuation based on company performance and realistic valuation.
So I don’t want to buy stocks that I know are overvalued when I don’t know when they will crash.
Buy Stocks at a Discount
I don’t know how to time markets and I believe US markets overvalued so I take the approach of value investing.
By investing in stocks that are trading for less than their book value I have a built in margin of safety.
That way I have good reason to believe I’m not buying a security that will drop radically in price since a value stock is by definition already undervalued.
I think it’s a great way to grow wealth in good times and bad.
Later this week I’ll be unveiling some additional refinements to my value investing metrics.
[mc4wp_form id=”4538″]